29
/
en
AIzaSyAYiBZKx7MnpbEhh9jyipgxe19OcubqV5w
April 1, 2024
94159
Bulgaria
BGR
true
2
1
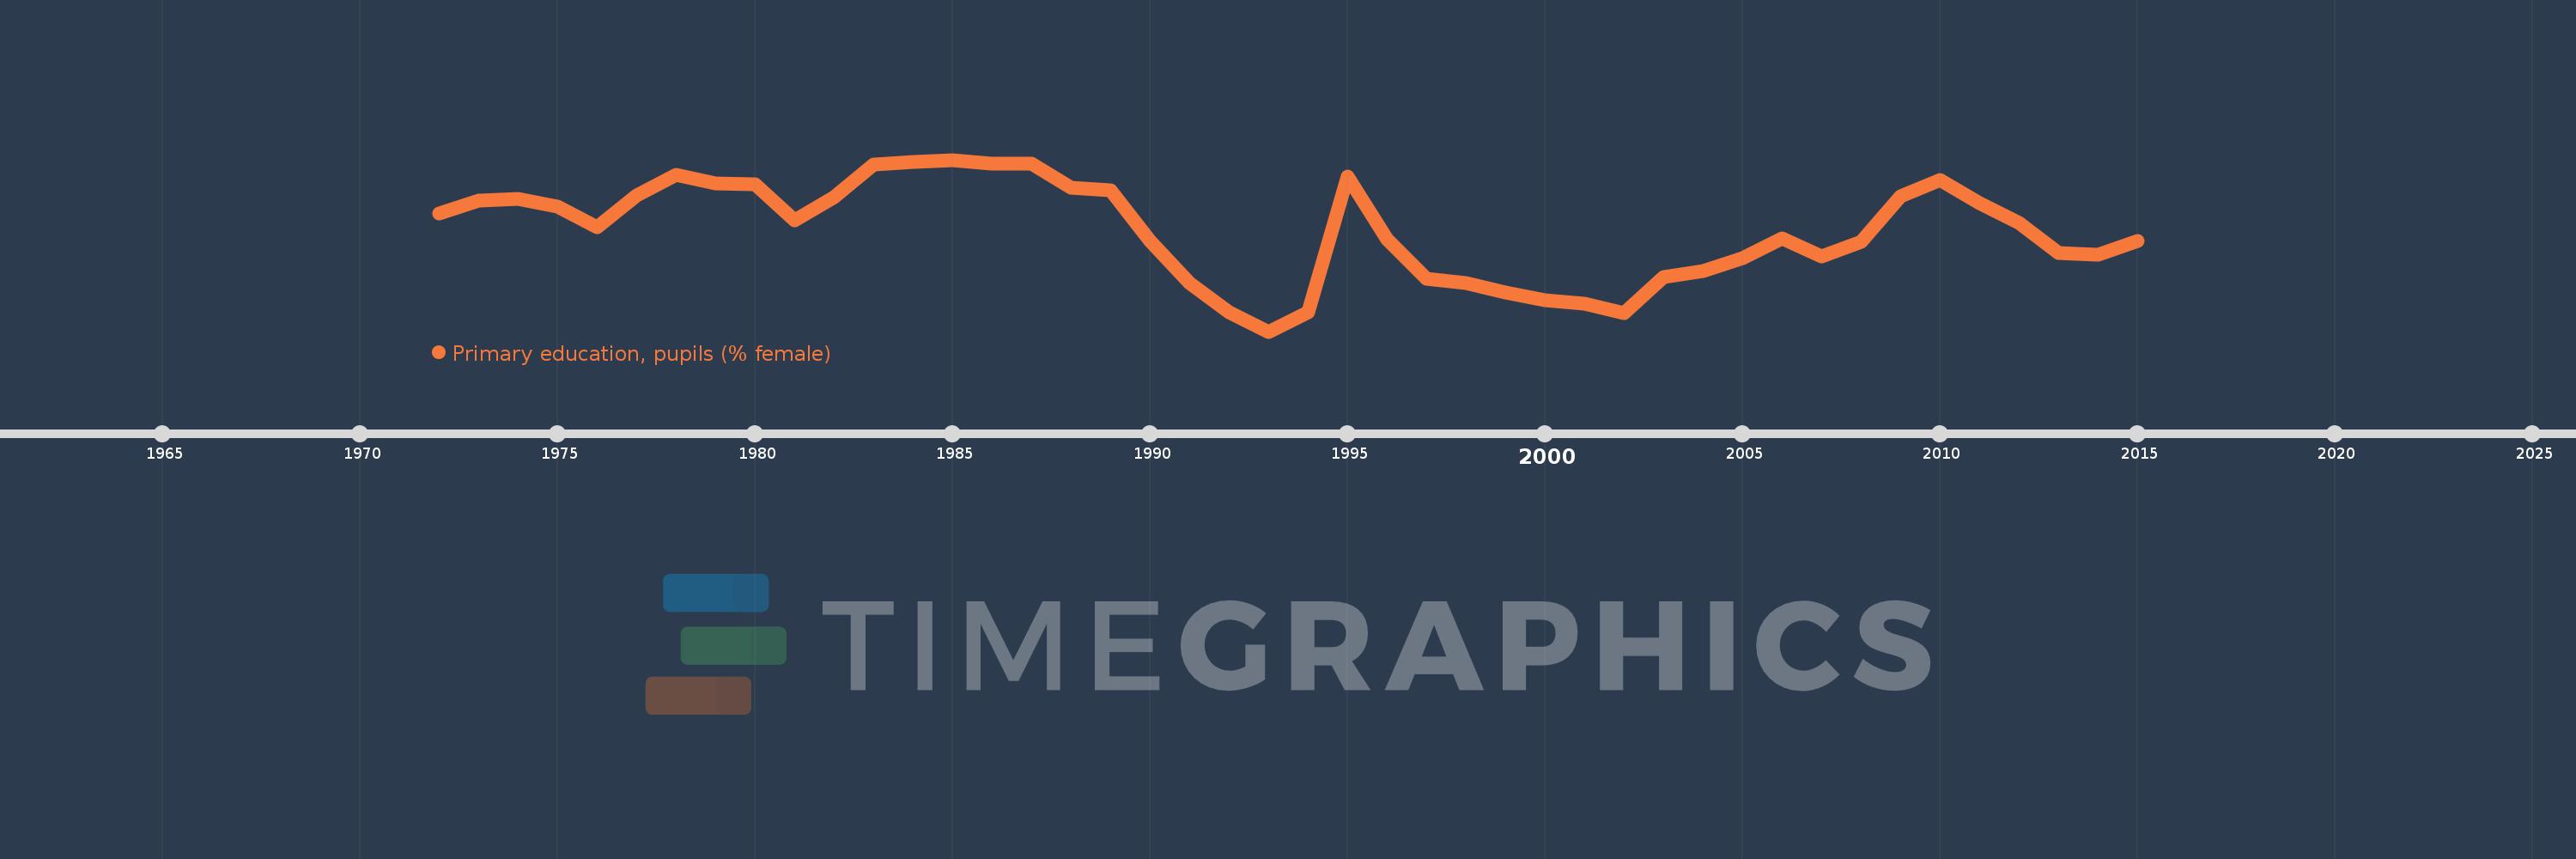
Primary education, pupils (% female)
2015,2014,2013,2012,2011,2010,2009,2008,2007,2006,2005,2004,2003,2002,2001,2000,1999,1998,1997,1996,1995,1994,1993,1992,1991,1990,1989,1988,1987,1986,1985,1984,1983,1982,1981,1980,1979,1978,1977,1976,1975,1974,1973,1972
This statistics in other country:
AfghanistanAlbaniaAlgeriaAndorraAngolaAntigua and BarbudaArab WorldArgentinaArmeniaArubaAustraliaAustriaAzerbaijanBahamas, TheBahrainBangladeshBarbadosBelarusBelgiumBelizeBeninBermudaBhutanBoliviaBosnia and HerzegovinaBotswanaBrazilBritish Virgin IslandsBrunei DarussalamBulgariaBurkina FasoBurundiCabo VerdeCambodiaCameroonCanadaCaribbean small statesCayman IslandsCentral African RepublicCentral Europe and the BalticsChadChileChinaColombiaComorosCongo, Dem. Rep.Congo, Rep.Costa RicaCote d'IvoireCroatiaCubaCuracaoCyprusCzech RepublicDenmarkDjiboutiDominicaDominican RepublicEarly-demographic dividendEast Asia & PacificEast Asia & Pacific (excluding high income)East Asia & Pacific (IDA & IBRD countries)EcuadorEgypt, Arab Rep.El SalvadorEquatorial GuineaEritreaEstoniaEthiopiaEuro areaEurope & Central AsiaEurope & Central Asia (excluding high income)Europe & Central Asia (IDA & IBRD countries)European UnionFijiFinlandFragile and conflict affected situationsFranceGabonGambia, TheGeorgiaGermanyGhanaGibraltarGreeceGrenadaGuatemalaGuineaGuinea-BissauGuyanaHaitiHeavily indebted poor countries (HIPC)High incomeHondurasHong Kong SAR, ChinaHungaryIBRD onlyIcelandIDA & IBRD totalIDA blendIDA onlyIDA totalIndiaIndonesiaIran, Islamic Rep.IraqIrelandIsraelItalyJamaicaJapanJordanKazakhstanKenyaKiribatiKorea, Dem. People’s Rep.Korea, Rep.KuwaitKyrgyz RepublicLao PDRLate-demographic dividendLatin America & Caribbean Latin America & Caribbean (excluding high income)Latin America & the Caribbean (IDA & IBRD countries)LatviaLeast developed countries: UN classificationLebanonLesothoLiberiaLibyaLiechtensteinLithuaniaLow & middle incomeLow incomeLower middle incomeLuxembourgMacao SAR, ChinaMacedonia, FYRMadagascarMalawiMalaysiaMaldivesMaliMaltaMarshall IslandsMauritaniaMauritiusMexicoMicronesia, Fed. Sts.Middle East & North AfricaMiddle East & North Africa (excluding high income)Middle East & North Africa (IDA & IBRD countries)Middle incomeMoldovaMonacoMongoliaMontenegroMoroccoMozambiqueMyanmarNamibiaNauruNepalNetherlandsNew ZealandNicaraguaNigerNigeriaNorth AmericaNorwayOECD membersOmanOther small statesPacific island small statesPakistanPalauPanamaPapua New GuineaParaguayPeruPhilippinesPolandPortugalPost-demographic dividendPre-demographic dividendPuerto RicoQatarRomaniaRussian FederationRwandaSamoaSan MarinoSao Tome and PrincipeSaudi ArabiaSenegalSerbiaSeychellesSierra LeoneSingaporeSint Maarten (Dutch part)Slovak RepublicSloveniaSmall statesSolomon IslandsSomaliaSouth AfricaSouth AsiaSouth Asia (IDA & IBRD)South SudanSpainSri LankaSt. Kitts and NevisSt. LuciaSt. Vincent and the GrenadinesSub-Saharan Africa Sub-Saharan Africa (excluding high income)Sub-Saharan Africa (IDA & IBRD countries)SudanSurinameSwazilandSwedenSwitzerlandSyrian Arab RepublicTajikistanTanzaniaThailandTimor-LesteTogoTongaTrinidad and TobagoTunisiaTurkeyTurkmenistanTurks and Caicos IslandsTuvaluUgandaUkraineUnited Arab EmiratesUnited KingdomUnited StatesUpper middle incomeUruguayUzbekistanVanuatuVenezuela, RBVietnamWest Bank and GazaWorldYemen, Rep.ZambiaZimbabwe Timeline:
This timeline shows a graph from 1972 to 2015 of Bulgaria. No data until 1971. Number of actual observations by date: 44.
Source name:
World Development Indicators
Source organization:
United Nations Educational, Scientific, and Cultural Organization (UNESCO) Institute for Statistics.
Categories, topics:
Education, Gender
Last updated:
apr 23, 2017
Indicators value changes by year
At the date of observation
Value
Absolute change
Change from previous value
jan 1, 1972
48.44
+48.44
0.0%
jan 1, 1973
48.486
+0.046
0.09%
jan 1, 1974
48.49
+0.004
0.01%
jan 1, 1975
48.463
-0.027
-0.06%
jan 1, 1976
48.392
-0.071
-0.15%
jan 1, 1977
48.503
+0.111
0.23%
jan 1, 1978
48.578
+0.075
0.16%
jan 1, 1979
48.546
-0.033
-0.07%
jan 1, 1980
48.543
-0.003
-0.01%
jan 1, 1981
48.416
-0.128
-0.26%
jan 1, 1982
48.496
+0.08
0.17%
jan 1, 1983
48.613
+0.117
0.24%
jan 1, 1984
48.621
+0.008
0.02%
jan 1, 1985
48.63
+0.009
0.02%
jan 1, 1986
48.615
-0.015
-0.03%
jan 1, 1987
48.617
+0.002
0.0%
jan 1, 1988
48.532
-0.085
-0.17%
jan 1, 1989
48.522
-0.01
-0.02%
jan 1, 1990
48.342
-0.18
-0.37%
jan 1, 1991
48.191
-0.151
-0.31%
jan 1, 1992
48.09
-0.101
-0.21%
jan 1, 1993
48.02
-0.071
-0.15%
jan 1, 1994
48.088
+0.068
0.14%
jan 1, 1995
48.572
+0.484
1.01%
jan 1, 1996
48.347
-0.224
-0.46%
jan 1, 1997
48.209
-0.138
-0.29%
jan 1, 1998
48.192
-0.017
-0.04%
jan 1, 1999
48.159
-0.033
-0.07%
jan 1, 2000
48.131
-0.028
-0.06%
jan 1, 2001
48.119
-0.012
-0.03%
jan 1, 2002
48.085
-0.034
-0.07%
jan 1, 2003
48.214
+0.129
0.27%
jan 1, 2004
48.235
+0.021
0.04%
jan 1, 2005
48.282
+0.046
0.1%
jan 1, 2006
48.352
+0.071
0.15%
jan 1, 2007
48.288
-0.064
-0.13%
jan 1, 2008
48.339
+0.051
0.11%
jan 1, 2009
48.5
+0.161
0.33%
jan 1, 2010
48.559
+0.059
0.12%
jan 1, 2011
48.476
-0.083
-0.17%
jan 1, 2012
48.405
-0.071
-0.15%
jan 1, 2013
48.3
-0.105
-0.22%
jan 1, 2014
48.292
-0.008
-0.02%
jan 1, 2015
48.341
+0.049
0.1%
Ranking of countries by current statistics by years


Comments: