29
/
en
AIzaSyAYiBZKx7MnpbEhh9jyipgxe19OcubqV5w
April 1, 2024
286503
Zambia
ZMB
true
2
1
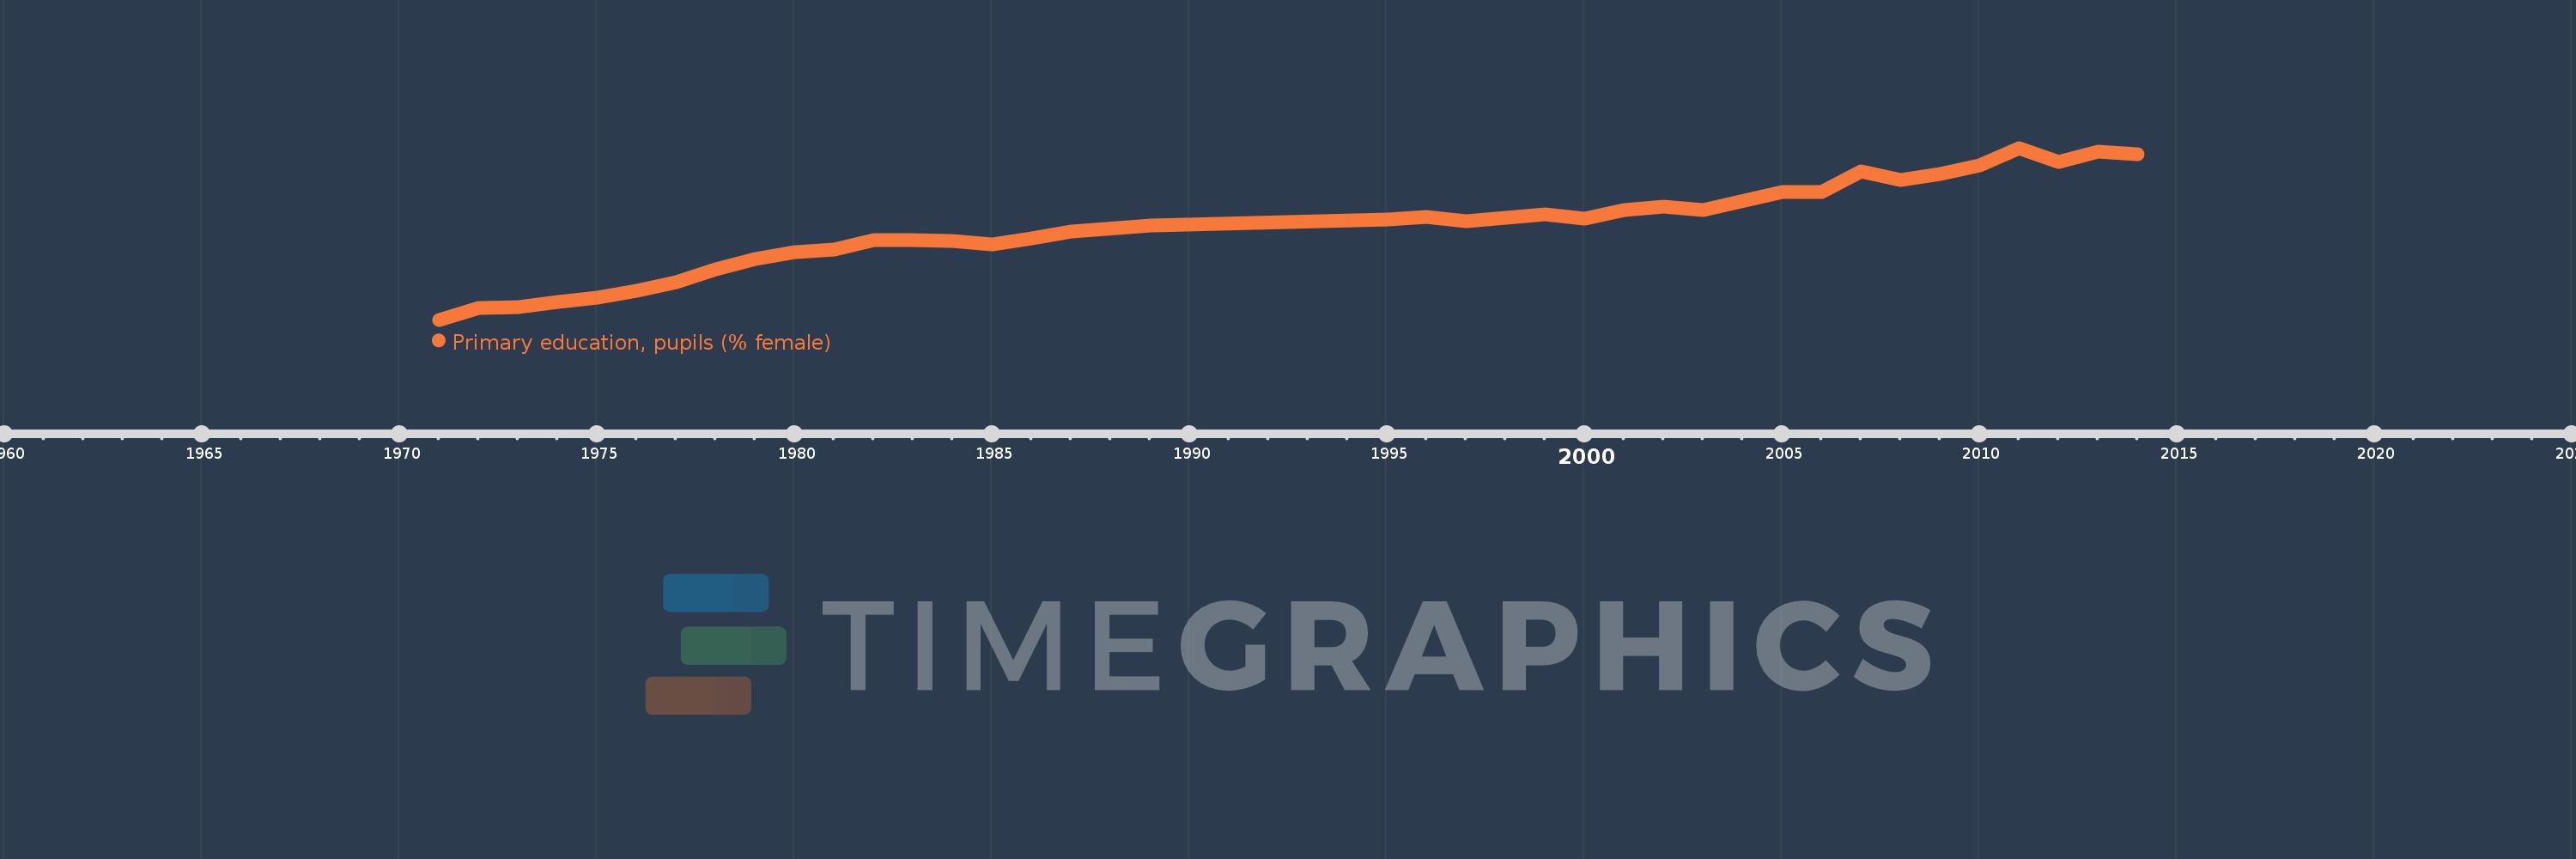
Primary education, pupils (% female)
2014,2013,2012,2011,2010,2009,2008,2007,2006,2005,2003,2002,2001,2000,1999,1997,1996,1995,1989,1987,1986,1985,1984,1983,1982,1981,1980,1979,1978,1977,1976,1975,1974,1973,1972,1971
This statistics in other country:
AfghanistanAlbaniaAlgeriaAndorraAngolaAntigua and BarbudaArab WorldArgentinaArmeniaArubaAustraliaAustriaAzerbaijanBahamas, TheBahrainBangladeshBarbadosBelarusBelgiumBelizeBeninBermudaBhutanBoliviaBosnia and HerzegovinaBotswanaBrazilBritish Virgin IslandsBrunei DarussalamBulgariaBurkina FasoBurundiCabo VerdeCambodiaCameroonCanadaCaribbean small statesCayman IslandsCentral African RepublicCentral Europe and the BalticsChadChileChinaColombiaComorosCongo, Dem. Rep.Congo, Rep.Costa RicaCote d'IvoireCroatiaCubaCuracaoCyprusCzech RepublicDenmarkDjiboutiDominicaDominican RepublicEarly-demographic dividendEast Asia & PacificEast Asia & Pacific (excluding high income)East Asia & Pacific (IDA & IBRD countries)EcuadorEgypt, Arab Rep.El SalvadorEquatorial GuineaEritreaEstoniaEthiopiaEuro areaEurope & Central AsiaEurope & Central Asia (excluding high income)Europe & Central Asia (IDA & IBRD countries)European UnionFijiFinlandFragile and conflict affected situationsFranceGabonGambia, TheGeorgiaGermanyGhanaGibraltarGreeceGrenadaGuatemalaGuineaGuinea-BissauGuyanaHaitiHeavily indebted poor countries (HIPC)High incomeHondurasHong Kong SAR, ChinaHungaryIBRD onlyIcelandIDA & IBRD totalIDA blendIDA onlyIDA totalIndiaIndonesiaIran, Islamic Rep.IraqIrelandIsraelItalyJamaicaJapanJordanKazakhstanKenyaKiribatiKorea, Dem. People’s Rep.Korea, Rep.KuwaitKyrgyz RepublicLao PDRLate-demographic dividendLatin America & Caribbean Latin America & Caribbean (excluding high income)Latin America & the Caribbean (IDA & IBRD countries)LatviaLeast developed countries: UN classificationLebanonLesothoLiberiaLibyaLiechtensteinLithuaniaLow & middle incomeLow incomeLower middle incomeLuxembourgMacao SAR, ChinaMacedonia, FYRMadagascarMalawiMalaysiaMaldivesMaliMaltaMarshall IslandsMauritaniaMauritiusMexicoMicronesia, Fed. Sts.Middle East & North AfricaMiddle East & North Africa (excluding high income)Middle East & North Africa (IDA & IBRD countries)Middle incomeMoldovaMonacoMongoliaMontenegroMoroccoMozambiqueMyanmarNamibiaNauruNepalNetherlandsNew ZealandNicaraguaNigerNigeriaNorth AmericaNorwayOECD membersOmanOther small statesPacific island small statesPakistanPalauPanamaPapua New GuineaParaguayPeruPhilippinesPolandPortugalPost-demographic dividendPre-demographic dividendPuerto RicoQatarRomaniaRussian FederationRwandaSamoaSan MarinoSao Tome and PrincipeSaudi ArabiaSenegalSerbiaSeychellesSierra LeoneSingaporeSint Maarten (Dutch part)Slovak RepublicSloveniaSmall statesSolomon IslandsSomaliaSouth AfricaSouth AsiaSouth Asia (IDA & IBRD)South SudanSpainSri LankaSt. Kitts and NevisSt. LuciaSt. Vincent and the GrenadinesSub-Saharan Africa Sub-Saharan Africa (excluding high income)Sub-Saharan Africa (IDA & IBRD countries)SudanSurinameSwazilandSwedenSwitzerlandSyrian Arab RepublicTajikistanTanzaniaThailandTimor-LesteTogoTongaTrinidad and TobagoTunisiaTurkeyTurkmenistanTurks and Caicos IslandsTuvaluUgandaUkraineUnited Arab EmiratesUnited KingdomUnited StatesUpper middle incomeUruguayUzbekistanVanuatuVenezuela, RBVietnamWest Bank and GazaWorldYemen, Rep.ZambiaZimbabwe Timeline:
This timeline shows a graph from 1971 to 2014 of Zambia. No data until 1970. Number of actual observations by date: 36.
Source name:
World Development Indicators
Source organization:
United Nations Educational, Scientific, and Cultural Organization (UNESCO) Institute for Statistics.
Categories, topics:
Education, Gender
Last updated:
apr 23, 2017
Indicators value changes by year
Minimum:
44.481
jan 1, 1971
Maximum:
50.108
jan 1, 2011
At the date of observation
Value
Absolute change
Change from previous value
jan 1, 1971
44.481
+44.481
0.0%
jan 1, 1972
44.871
+0.39
0.88%
jan 1, 1973
44.889
+0.018
0.04%
jan 1, 1974
45.076
+0.187
0.42%
jan 1, 1975
45.211
+0.135
0.3%
jan 1, 1976
45.436
+0.225
0.5%
jan 1, 1977
45.708
+0.272
0.6%
jan 1, 1978
46.129
+0.421
0.92%
jan 1, 1979
46.462
+0.333
0.72%
jan 1, 1980
46.683
+0.221
0.48%
jan 1, 1981
46.782
+0.098
0.21%
jan 1, 1982
47.077
+0.295
0.63%
jan 1, 1983
47.079
+0.003
0.01%
jan 1, 1984
47.07
-0.009
-0.02%
jan 1, 1985
46.946
-0.124
-0.26%
jan 1, 1986
47.135
+0.189
0.4%
jan 1, 1987
47.371
+0.236
0.5%
jan 1, 1989
47.562
+0.191
0.4%
jan 1, 1995
47.764
+0.203
0.43%
jan 1, 1996
47.838
+0.074
0.15%
jan 1, 1997
47.713
-0.125
-0.26%
jan 1, 1999
47.929
+0.216
0.45%
jan 1, 2000
47.794
-0.136
-0.28%
jan 1, 2001
48.079
+0.285
0.6%
jan 1, 2002
48.179
+0.101
0.21%
jan 1, 2003
48.076
-0.103
-0.21%
jan 1, 2005
48.667
+0.591
1.23%
jan 1, 2006
48.67
+0.003
0.01%
jan 1, 2007
49.337
+0.667
1.37%
jan 1, 2008
49.05
-0.287
-0.58%
jan 1, 2009
49.253
+0.203
0.41%
jan 1, 2010
49.53
+0.277
0.56%
jan 1, 2011
50.108
+0.578
1.17%
jan 1, 2012
49.639
-0.469
-0.94%
jan 1, 2013
49.973
+0.334
0.67%
jan 1, 2014
49.896
-0.077
-0.15%
Ranking of countries by current statistics by years


Comments: