29
/
en
AIzaSyAYiBZKx7MnpbEhh9jyipgxe19OcubqV5w
April 1, 2024
104165
Chad
TCD
true
2
1
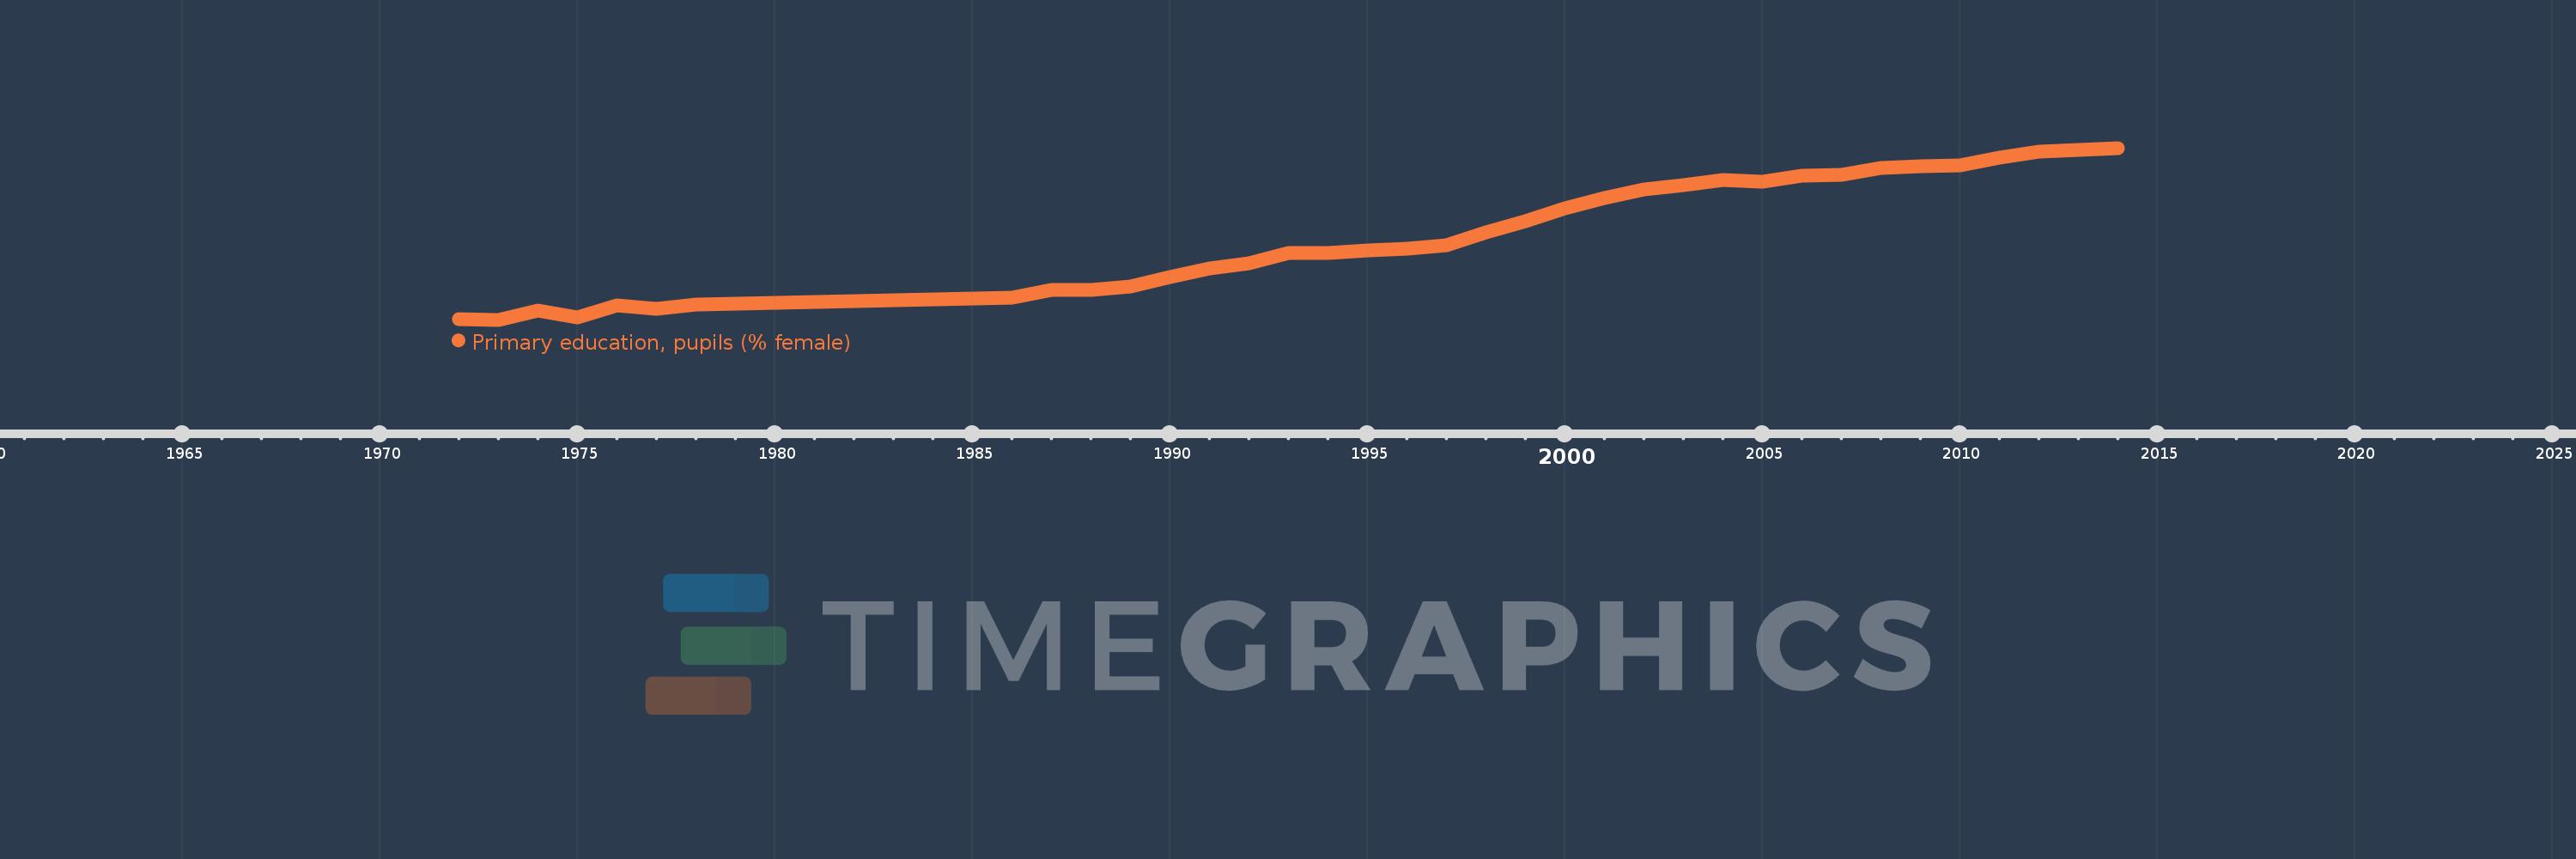
Primary education, pupils (% female)
2014,2013,2012,2011,2010,2009,2008,2007,2006,2005,2004,2003,2002,2001,2000,1999,1998,1997,1996,1995,1994,1993,1992,1991,1990,1989,1988,1987,1986,1978,1977,1976,1975,1974,1973,1972
This statistics in other country:
AfghanistanAlbaniaAlgeriaAndorraAngolaAntigua and BarbudaArab WorldArgentinaArmeniaArubaAustraliaAustriaAzerbaijanBahamas, TheBahrainBangladeshBarbadosBelarusBelgiumBelizeBeninBermudaBhutanBoliviaBosnia and HerzegovinaBotswanaBrazilBritish Virgin IslandsBrunei DarussalamBulgariaBurkina FasoBurundiCabo VerdeCambodiaCameroonCanadaCaribbean small statesCayman IslandsCentral African RepublicCentral Europe and the BalticsChadChileChinaColombiaComorosCongo, Dem. Rep.Congo, Rep.Costa RicaCote d'IvoireCroatiaCubaCuracaoCyprusCzech RepublicDenmarkDjiboutiDominicaDominican RepublicEarly-demographic dividendEast Asia & PacificEast Asia & Pacific (excluding high income)East Asia & Pacific (IDA & IBRD countries)EcuadorEgypt, Arab Rep.El SalvadorEquatorial GuineaEritreaEstoniaEthiopiaEuro areaEurope & Central AsiaEurope & Central Asia (excluding high income)Europe & Central Asia (IDA & IBRD countries)European UnionFijiFinlandFragile and conflict affected situationsFranceGabonGambia, TheGeorgiaGermanyGhanaGibraltarGreeceGrenadaGuatemalaGuineaGuinea-BissauGuyanaHaitiHeavily indebted poor countries (HIPC)High incomeHondurasHong Kong SAR, ChinaHungaryIBRD onlyIcelandIDA & IBRD totalIDA blendIDA onlyIDA totalIndiaIndonesiaIran, Islamic Rep.IraqIrelandIsraelItalyJamaicaJapanJordanKazakhstanKenyaKiribatiKorea, Dem. People’s Rep.Korea, Rep.KuwaitKyrgyz RepublicLao PDRLate-demographic dividendLatin America & Caribbean Latin America & Caribbean (excluding high income)Latin America & the Caribbean (IDA & IBRD countries)LatviaLeast developed countries: UN classificationLebanonLesothoLiberiaLibyaLiechtensteinLithuaniaLow & middle incomeLow incomeLower middle incomeLuxembourgMacao SAR, ChinaMacedonia, FYRMadagascarMalawiMalaysiaMaldivesMaliMaltaMarshall IslandsMauritaniaMauritiusMexicoMicronesia, Fed. Sts.Middle East & North AfricaMiddle East & North Africa (excluding high income)Middle East & North Africa (IDA & IBRD countries)Middle incomeMoldovaMonacoMongoliaMontenegroMoroccoMozambiqueMyanmarNamibiaNauruNepalNetherlandsNew ZealandNicaraguaNigerNigeriaNorth AmericaNorwayOECD membersOmanOther small statesPacific island small statesPakistanPalauPanamaPapua New GuineaParaguayPeruPhilippinesPolandPortugalPost-demographic dividendPre-demographic dividendPuerto RicoQatarRomaniaRussian FederationRwandaSamoaSan MarinoSao Tome and PrincipeSaudi ArabiaSenegalSerbiaSeychellesSierra LeoneSingaporeSint Maarten (Dutch part)Slovak RepublicSloveniaSmall statesSolomon IslandsSomaliaSouth AfricaSouth AsiaSouth Asia (IDA & IBRD)South SudanSpainSri LankaSt. Kitts and NevisSt. LuciaSt. Vincent and the GrenadinesSub-Saharan Africa Sub-Saharan Africa (excluding high income)Sub-Saharan Africa (IDA & IBRD countries)SudanSurinameSwazilandSwedenSwitzerlandSyrian Arab RepublicTajikistanTanzaniaThailandTimor-LesteTogoTongaTrinidad and TobagoTunisiaTurkeyTurkmenistanTurks and Caicos IslandsTuvaluUgandaUkraineUnited Arab EmiratesUnited KingdomUnited StatesUpper middle incomeUruguayUzbekistanVanuatuVenezuela, RBVietnamWest Bank and GazaWorldYemen, Rep.ZambiaZimbabwe Timeline:
This timeline shows a graph from 1972 to 2014 of Chad. No data until 1971. Number of actual observations by date: 36.
Source name:
World Development Indicators
Source organization:
United Nations Educational, Scientific, and Cultural Organization (UNESCO) Institute for Statistics.
Categories, topics:
Education, Gender
Last updated:
apr 23, 2017
Indicators value changes by year
Maximum:
43.012
jan 1, 2014
At the date of observation
Value
Absolute change
Change from previous value
jan 1, 1972
25.207
+25.207
0.0%
jan 1, 1973
25.1
-0.107
-0.42%
jan 1, 1974
26.1
+1.0
3.98%
jan 1, 1975
25.364
-0.736
-2.82%
jan 1, 1976
26.552
+1.189
4.69%
jan 1, 1977
26.276
-0.277
-1.04%
jan 1, 1978
26.72
+0.444
1.69%
jan 1, 1986
27.376
+0.656
2.46%
jan 1, 1987
28.234
+0.858
3.13%
jan 1, 1988
28.231
-0.003
-0.01%
jan 1, 1989
28.584
+0.354
1.25%
jan 1, 1990
29.58
+0.996
3.48%
jan 1, 1991
30.463
+0.883
2.99%
jan 1, 1992
31.011
+0.547
1.8%
jan 1, 1993
32.052
+1.042
3.36%
jan 1, 1994
32.102
+0.05
0.16%
jan 1, 1995
32.322
+0.22
0.69%
jan 1, 1996
32.481
+0.159
0.49%
jan 1, 1997
32.9
+0.419
1.29%
jan 1, 1998
34.252
+1.352
4.11%
jan 1, 1999
35.353
+1.101
3.21%
jan 1, 2000
36.743
+1.39
3.93%
jan 1, 2001
37.787
+1.045
2.84%
jan 1, 2002
38.722
+0.935
2.47%
jan 1, 2003
39.127
+0.405
1.05%
jan 1, 2004
39.705
+0.577
1.48%
jan 1, 2005
39.47
-0.235
-0.59%
jan 1, 2006
40.134
+0.664
1.68%
jan 1, 2007
40.249
+0.116
0.29%
jan 1, 2008
40.89
+0.64
1.59%
jan 1, 2009
41.094
+0.204
0.5%
jan 1, 2010
41.191
+0.097
0.24%
jan 1, 2011
42.017
+0.825
2.0%
jan 1, 2012
42.588
+0.571
1.36%
jan 1, 2013
42.847
+0.259
0.61%
jan 1, 2014
43.012
+0.165
0.39%
Ranking of countries by current statistics by years


Comments: