29
/
en
AIzaSyAYiBZKx7MnpbEhh9jyipgxe19OcubqV5w
April 1, 2024
52974
OECD members
OED
false
2
1
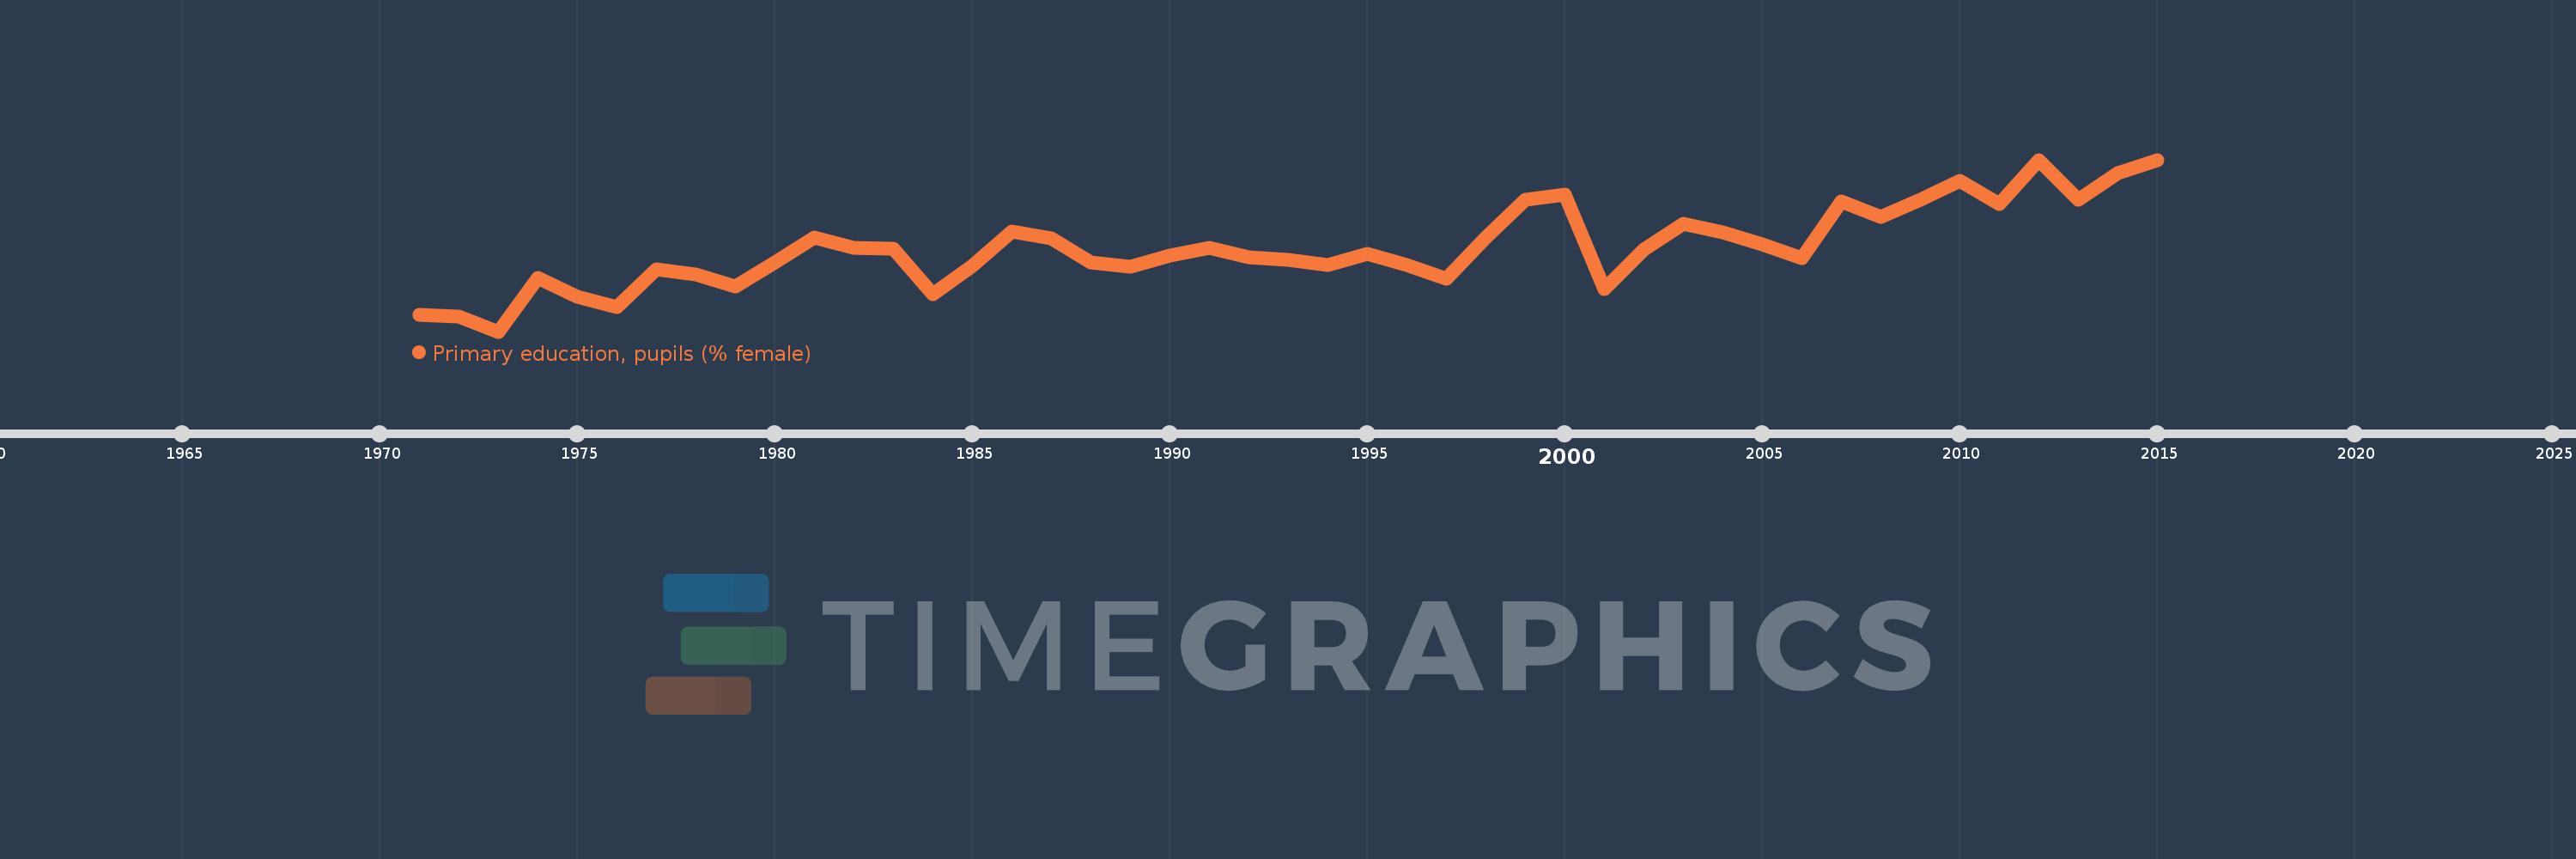
Primary education, pupils (% female)
2015,2014,2013,2012,2011,2010,2009,2008,2007,2006,2005,2004,2003,2002,2001,2000,1999,1998,1997,1996,1995,1994,1993,1992,1991,1990,1989,1988,1987,1986,1985,1984,1983,1982,1981,1980,1979,1978,1977,1976,1975,1974,1973,1972,1971
This statistics in other country:
AfghanistanAlbaniaAlgeriaAndorraAngolaAntigua and BarbudaArab WorldArgentinaArmeniaArubaAustraliaAustriaAzerbaijanBahamas, TheBahrainBangladeshBarbadosBelarusBelgiumBelizeBeninBermudaBhutanBoliviaBosnia and HerzegovinaBotswanaBrazilBritish Virgin IslandsBrunei DarussalamBulgariaBurkina FasoBurundiCabo VerdeCambodiaCameroonCanadaCaribbean small statesCayman IslandsCentral African RepublicCentral Europe and the BalticsChadChileChinaColombiaComorosCongo, Dem. Rep.Congo, Rep.Costa RicaCote d'IvoireCroatiaCubaCuracaoCyprusCzech RepublicDenmarkDjiboutiDominicaDominican RepublicEarly-demographic dividendEast Asia & PacificEast Asia & Pacific (excluding high income)East Asia & Pacific (IDA & IBRD countries)EcuadorEgypt, Arab Rep.El SalvadorEquatorial GuineaEritreaEstoniaEthiopiaEuro areaEurope & Central AsiaEurope & Central Asia (excluding high income)Europe & Central Asia (IDA & IBRD countries)European UnionFijiFinlandFragile and conflict affected situationsFranceGabonGambia, TheGeorgiaGermanyGhanaGibraltarGreeceGrenadaGuatemalaGuineaGuinea-BissauGuyanaHaitiHeavily indebted poor countries (HIPC)High incomeHondurasHong Kong SAR, ChinaHungaryIBRD onlyIcelandIDA & IBRD totalIDA blendIDA onlyIDA totalIndiaIndonesiaIran, Islamic Rep.IraqIrelandIsraelItalyJamaicaJapanJordanKazakhstanKenyaKiribatiKorea, Dem. People’s Rep.Korea, Rep.KuwaitKyrgyz RepublicLao PDRLate-demographic dividendLatin America & Caribbean Latin America & Caribbean (excluding high income)Latin America & the Caribbean (IDA & IBRD countries)LatviaLeast developed countries: UN classificationLebanonLesothoLiberiaLibyaLiechtensteinLithuaniaLow & middle incomeLow incomeLower middle incomeLuxembourgMacao SAR, ChinaMacedonia, FYRMadagascarMalawiMalaysiaMaldivesMaliMaltaMarshall IslandsMauritaniaMauritiusMexicoMicronesia, Fed. Sts.Middle East & North AfricaMiddle East & North Africa (excluding high income)Middle East & North Africa (IDA & IBRD countries)Middle incomeMoldovaMonacoMongoliaMontenegroMoroccoMozambiqueMyanmarNamibiaNauruNepalNetherlandsNew ZealandNicaraguaNigerNigeriaNorth AmericaNorwayOECD membersOmanOther small statesPacific island small statesPakistanPalauPanamaPapua New GuineaParaguayPeruPhilippinesPolandPortugalPost-demographic dividendPre-demographic dividendPuerto RicoQatarRomaniaRussian FederationRwandaSamoaSan MarinoSao Tome and PrincipeSaudi ArabiaSenegalSerbiaSeychellesSierra LeoneSingaporeSint Maarten (Dutch part)Slovak RepublicSloveniaSmall statesSolomon IslandsSomaliaSouth AfricaSouth AsiaSouth Asia (IDA & IBRD)South SudanSpainSri LankaSt. Kitts and NevisSt. LuciaSt. Vincent and the GrenadinesSub-Saharan Africa Sub-Saharan Africa (excluding high income)Sub-Saharan Africa (IDA & IBRD countries)SudanSurinameSwazilandSwedenSwitzerlandSyrian Arab RepublicTajikistanTanzaniaThailandTimor-LesteTogoTongaTrinidad and TobagoTunisiaTurkeyTurkmenistanTurks and Caicos IslandsTuvaluUgandaUkraineUnited Arab EmiratesUnited KingdomUnited StatesUpper middle incomeUruguayUzbekistanVanuatuVenezuela, RBVietnamWest Bank and GazaWorldYemen, Rep.ZambiaZimbabwe Timeline:
This timeline shows a graph from 1971 to 2015 of OECD members. No data until 1970. Number of actual observations by date: 45.
Source name:
World Development Indicators
Source organization:
United Nations Educational, Scientific, and Cultural Organization (UNESCO) Institute for Statistics.
Categories, topics:
Education, Gender
Last updated:
apr 23, 2017
Indicators value changes by year
Minimum:
48.266
jan 1, 1973
Maximum:
48.756
jan 1, 2012
At the date of observation
Value
Absolute change
Change from previous value
jan 1, 1971
48.313
+48.313
0.0%
jan 1, 1972
48.31
-0.003
-0.01%
jan 1, 1973
48.266
-0.044
-0.09%
jan 1, 1974
48.42
+0.154
0.32%
jan 1, 1975
48.365
-0.054
-0.11%
jan 1, 1976
48.336
-0.029
-0.06%
jan 1, 1977
48.443
+0.107
0.22%
jan 1, 1978
48.428
-0.015
-0.03%
jan 1, 1979
48.395
-0.033
-0.07%
jan 1, 1980
48.463
+0.068
0.14%
jan 1, 1981
48.534
+0.071
0.15%
jan 1, 1982
48.504
-0.031
-0.06%
jan 1, 1983
48.502
-0.002
0.0%
jan 1, 1984
48.373
-0.128
-0.26%
jan 1, 1985
48.454
+0.081
0.17%
jan 1, 1986
48.551
+0.096
0.2%
jan 1, 1987
48.531
-0.02
-0.04%
jan 1, 1988
48.464
-0.067
-0.14%
jan 1, 1989
48.452
-0.012
-0.02%
jan 1, 1990
48.483
+0.031
0.06%
jan 1, 1991
48.506
+0.023
0.05%
jan 1, 1992
48.477
-0.029
-0.06%
jan 1, 1993
48.47
-0.007
-0.01%
jan 1, 1994
48.455
-0.015
-0.03%
jan 1, 1995
48.487
+0.033
0.07%
jan 1, 1996
48.457
-0.03
-0.06%
jan 1, 1997
48.417
-0.04
-0.08%
jan 1, 1998
48.535
+0.118
0.24%
jan 1, 1999
48.642
+0.108
0.22%
jan 1, 2000
48.657
+0.014
0.03%
jan 1, 2001
48.387
-0.27
-0.55%
jan 1, 2002
48.5
+0.112
0.23%
jan 1, 2003
48.574
+0.075
0.15%
jan 1, 2004
48.55
-0.024
-0.05%
jan 1, 2005
48.515
-0.036
-0.07%
jan 1, 2006
48.476
-0.039
-0.08%
jan 1, 2007
48.636
+0.16
0.33%
jan 1, 2008
48.594
-0.042
-0.09%
jan 1, 2009
48.642
+0.048
0.1%
jan 1, 2010
48.697
+0.055
0.11%
jan 1, 2011
48.631
-0.066
-0.13%
jan 1, 2012
48.756
+0.124
0.26%
jan 1, 2013
48.641
-0.115
-0.24%
jan 1, 2014
48.719
+0.078
0.16%
jan 1, 2015
48.754
+0.035
0.07%
Ranking of countries by current statistics by years


Comments: