29
/
en
AIzaSyAYiBZKx7MnpbEhh9jyipgxe19OcubqV5w
April 1, 2024
100525
Cameroon
CMR
true
2
1
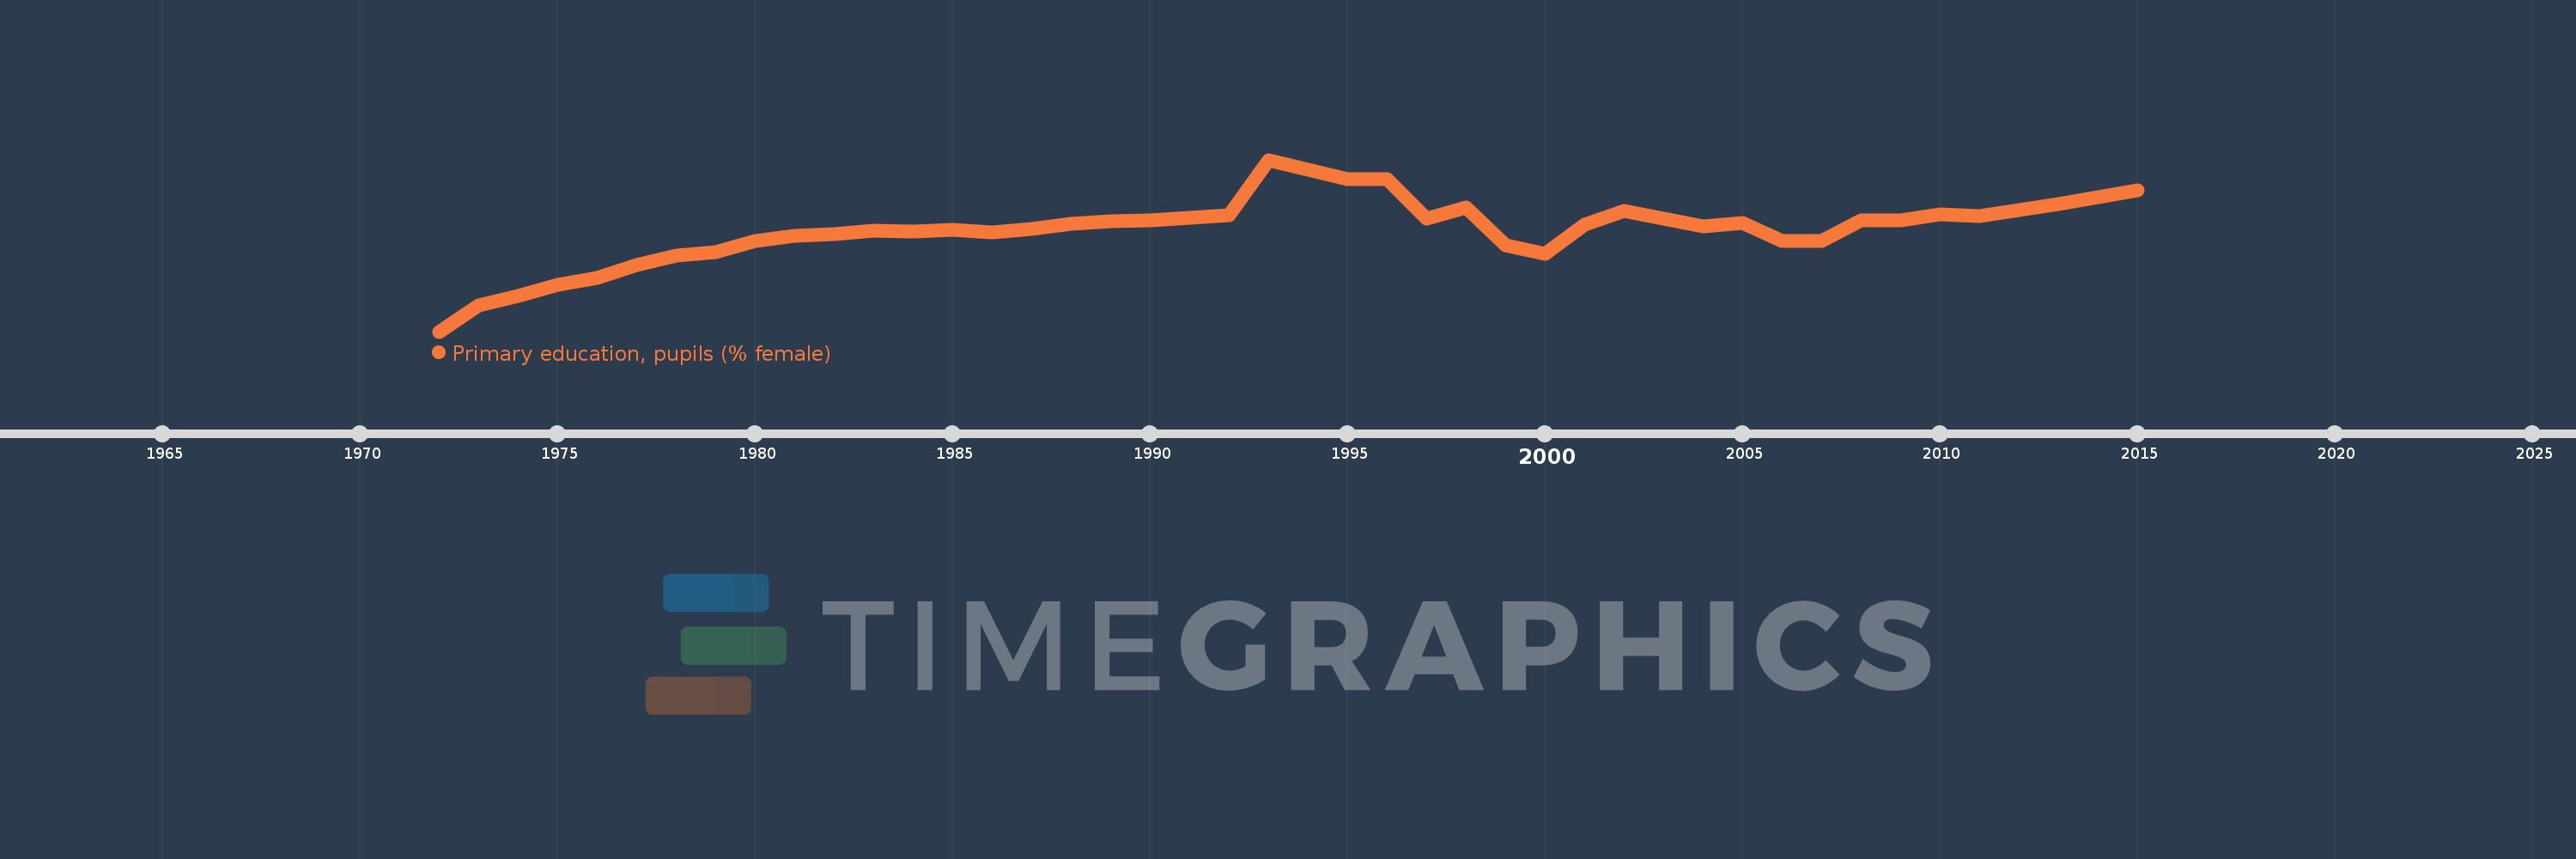
Primary education, pupils (% female)
2015,2013,2012,2011,2010,2009,2008,2007,2006,2005,2004,2003,2002,2001,2000,1999,1998,1997,1996,1995,1993,1992,1991,1990,1989,1988,1987,1986,1985,1984,1983,1982,1981,1980,1979,1978,1977,1976,1975,1974,1973,1972
This statistics in other country:
AfghanistanAlbaniaAlgeriaAndorraAngolaAntigua and BarbudaArab WorldArgentinaArmeniaArubaAustraliaAustriaAzerbaijanBahamas, TheBahrainBangladeshBarbadosBelarusBelgiumBelizeBeninBermudaBhutanBoliviaBosnia and HerzegovinaBotswanaBrazilBritish Virgin IslandsBrunei DarussalamBulgariaBurkina FasoBurundiCabo VerdeCambodiaCameroonCanadaCaribbean small statesCayman IslandsCentral African RepublicCentral Europe and the BalticsChadChileChinaColombiaComorosCongo, Dem. Rep.Congo, Rep.Costa RicaCote d'IvoireCroatiaCubaCuracaoCyprusCzech RepublicDenmarkDjiboutiDominicaDominican RepublicEarly-demographic dividendEast Asia & PacificEast Asia & Pacific (excluding high income)East Asia & Pacific (IDA & IBRD countries)EcuadorEgypt, Arab Rep.El SalvadorEquatorial GuineaEritreaEstoniaEthiopiaEuro areaEurope & Central AsiaEurope & Central Asia (excluding high income)Europe & Central Asia (IDA & IBRD countries)European UnionFijiFinlandFragile and conflict affected situationsFranceGabonGambia, TheGeorgiaGermanyGhanaGibraltarGreeceGrenadaGuatemalaGuineaGuinea-BissauGuyanaHaitiHeavily indebted poor countries (HIPC)High incomeHondurasHong Kong SAR, ChinaHungaryIBRD onlyIcelandIDA & IBRD totalIDA blendIDA onlyIDA totalIndiaIndonesiaIran, Islamic Rep.IraqIrelandIsraelItalyJamaicaJapanJordanKazakhstanKenyaKiribatiKorea, Dem. People’s Rep.Korea, Rep.KuwaitKyrgyz RepublicLao PDRLate-demographic dividendLatin America & Caribbean Latin America & Caribbean (excluding high income)Latin America & the Caribbean (IDA & IBRD countries)LatviaLeast developed countries: UN classificationLebanonLesothoLiberiaLibyaLiechtensteinLithuaniaLow & middle incomeLow incomeLower middle incomeLuxembourgMacao SAR, ChinaMacedonia, FYRMadagascarMalawiMalaysiaMaldivesMaliMaltaMarshall IslandsMauritaniaMauritiusMexicoMicronesia, Fed. Sts.Middle East & North AfricaMiddle East & North Africa (excluding high income)Middle East & North Africa (IDA & IBRD countries)Middle incomeMoldovaMonacoMongoliaMontenegroMoroccoMozambiqueMyanmarNamibiaNauruNepalNetherlandsNew ZealandNicaraguaNigerNigeriaNorth AmericaNorwayOECD membersOmanOther small statesPacific island small statesPakistanPalauPanamaPapua New GuineaParaguayPeruPhilippinesPolandPortugalPost-demographic dividendPre-demographic dividendPuerto RicoQatarRomaniaRussian FederationRwandaSamoaSan MarinoSao Tome and PrincipeSaudi ArabiaSenegalSerbiaSeychellesSierra LeoneSingaporeSint Maarten (Dutch part)Slovak RepublicSloveniaSmall statesSolomon IslandsSomaliaSouth AfricaSouth AsiaSouth Asia (IDA & IBRD)South SudanSpainSri LankaSt. Kitts and NevisSt. LuciaSt. Vincent and the GrenadinesSub-Saharan Africa Sub-Saharan Africa (excluding high income)Sub-Saharan Africa (IDA & IBRD countries)SudanSurinameSwazilandSwedenSwitzerlandSyrian Arab RepublicTajikistanTanzaniaThailandTimor-LesteTogoTongaTrinidad and TobagoTunisiaTurkeyTurkmenistanTurks and Caicos IslandsTuvaluUgandaUkraineUnited Arab EmiratesUnited KingdomUnited StatesUpper middle incomeUruguayUzbekistanVanuatuVenezuela, RBVietnamWest Bank and GazaWorldYemen, Rep.ZambiaZimbabwe Timeline:
This timeline shows a graph from 1972 to 2015 of Cameroon. No data until 1971. Number of actual observations by date: 42.
Source name:
World Development Indicators
Source organization:
United Nations Educational, Scientific, and Cultural Organization (UNESCO) Institute for Statistics.
Categories, topics:
Education, Gender
Last updated:
apr 23, 2017
Indicators value changes by year
Minimum:
42.545
jan 1, 1972
Maximum:
47.679
jan 1, 1993
At the date of observation
Value
Absolute change
Change from previous value
jan 1, 1972
42.545
+42.545
0.0%
jan 1, 1973
43.323
+0.778
1.83%
jan 1, 1974
43.617
+0.295
0.68%
jan 1, 1975
43.947
+0.33
0.76%
jan 1, 1976
44.142
+0.195
0.44%
jan 1, 1977
44.532
+0.39
0.88%
jan 1, 1978
44.806
+0.274
0.61%
jan 1, 1979
44.928
+0.122
0.27%
jan 1, 1980
45.263
+0.335
0.75%
jan 1, 1981
45.418
+0.155
0.34%
jan 1, 1982
45.459
+0.04
0.09%
jan 1, 1983
45.551
+0.093
0.2%
jan 1, 1984
45.535
-0.016
-0.04%
jan 1, 1985
45.578
+0.043
0.09%
jan 1, 1986
45.505
-0.073
-0.16%
jan 1, 1987
45.611
+0.106
0.23%
jan 1, 1988
45.775
+0.164
0.36%
jan 1, 1989
45.851
+0.076
0.17%
jan 1, 1990
45.879
+0.028
0.06%
jan 1, 1991
45.955
+0.076
0.16%
jan 1, 1992
46.034
+0.08
0.17%
jan 1, 1993
47.679
+1.645
3.57%
jan 1, 1995
47.102
-0.578
-1.21%
jan 1, 1996
47.114
+0.012
0.03%
jan 1, 1997
45.914
-1.2
-2.55%
jan 1, 1998
46.253
+0.34
0.74%
jan 1, 1999
45.114
-1.14
-2.46%
jan 1, 2000
44.866
-0.248
-0.55%
jan 1, 2001
45.744
+0.878
1.96%
jan 1, 2002
46.156
+0.413
0.9%
jan 1, 2003
45.93
-0.226
-0.49%
jan 1, 2004
45.696
-0.235
-0.51%
jan 1, 2005
45.789
+0.093
0.2%
jan 1, 2006
45.246
-0.542
-1.18%
jan 1, 2007
45.246
0.0
0.0%
jan 1, 2008
45.88
+0.634
1.4%
jan 1, 2009
45.873
-0.007
-0.02%
jan 1, 2010
46.055
+0.183
0.4%
jan 1, 2011
46.002
-0.053
-0.12%
jan 1, 2012
46.167
+0.165
0.36%
jan 1, 2013
46.359
+0.192
0.42%
jan 1, 2015
46.759
+0.4
0.86%
Ranking of countries by current statistics by years


Comments: