29
/
en
AIzaSyAYiBZKx7MnpbEhh9jyipgxe19OcubqV5w
April 1, 2024
66612
Algeria
DZA
true
2
1
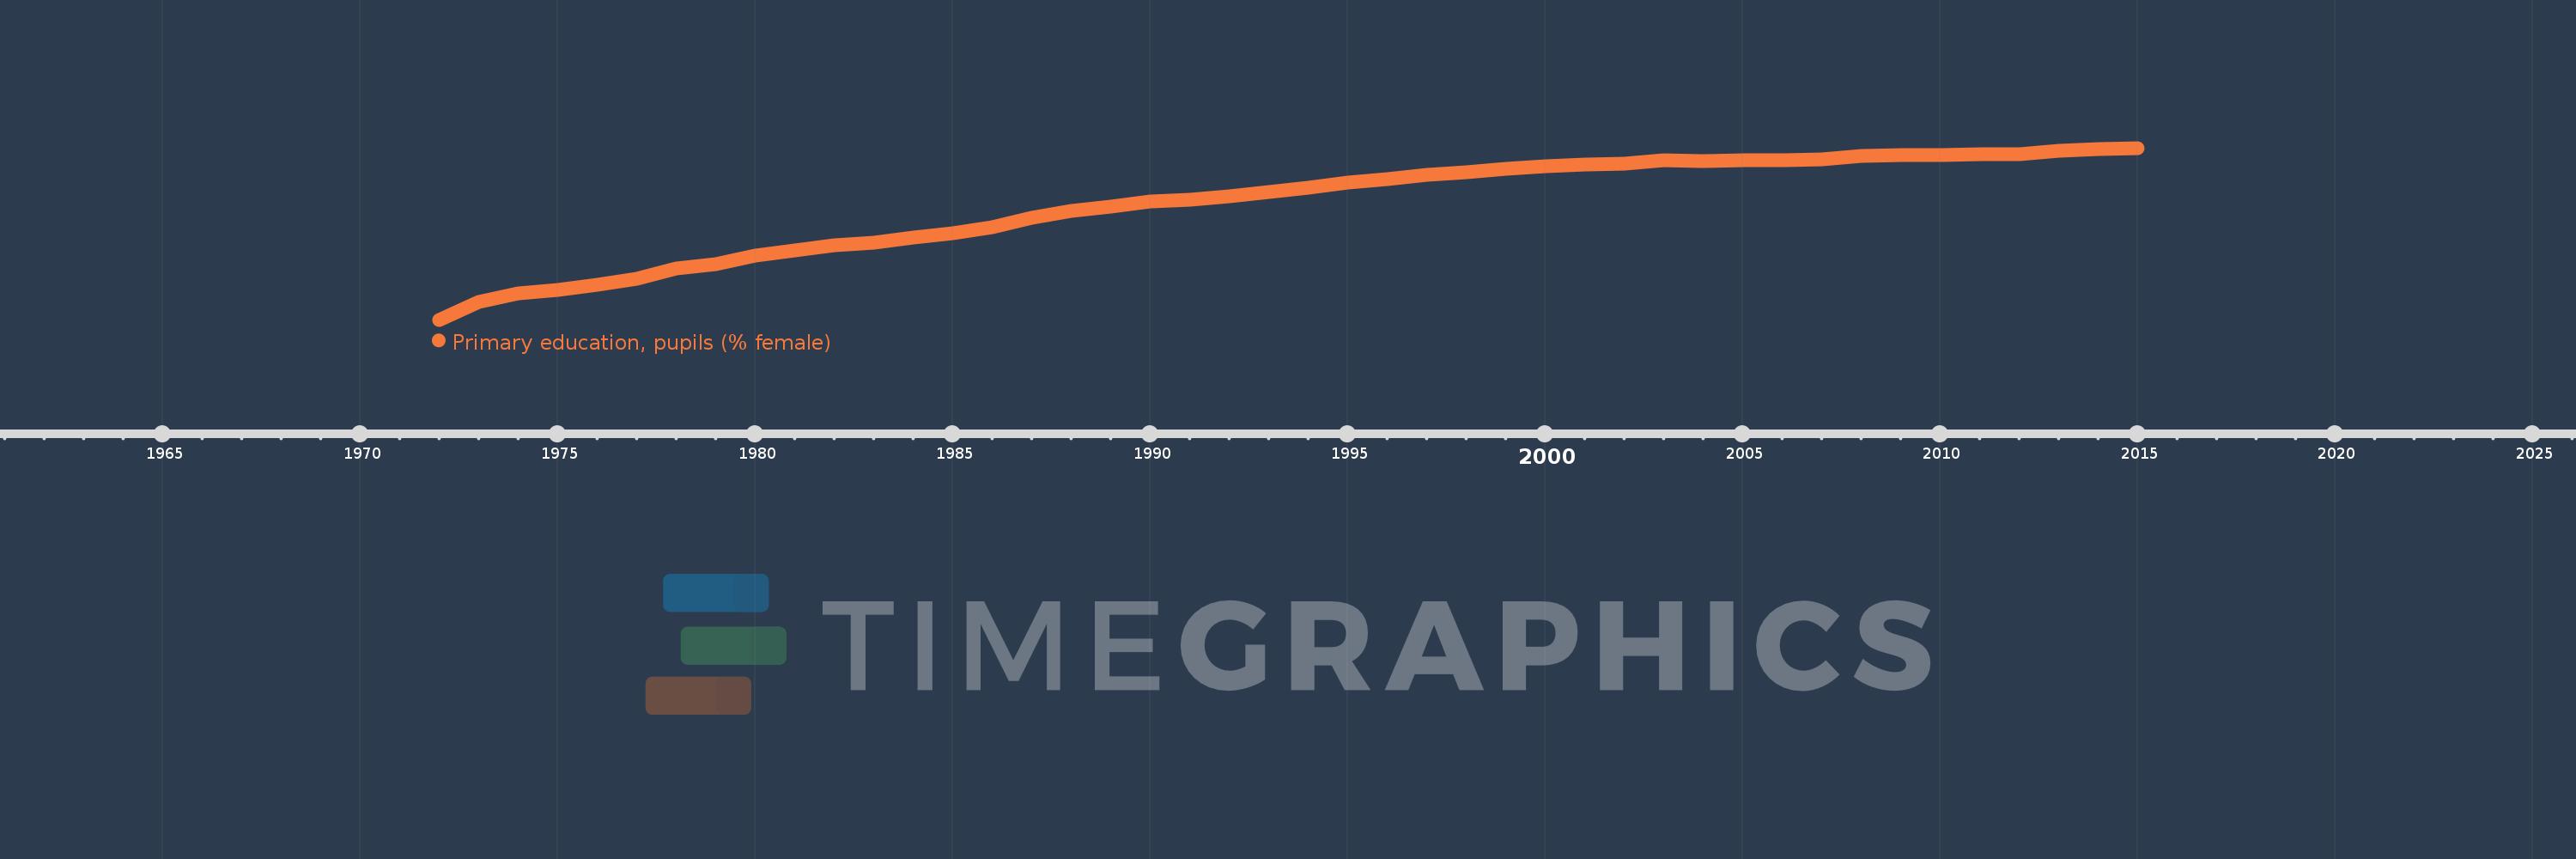
Primary education, pupils (% female)
2015,2014,2013,2012,2011,2010,2009,2008,2007,2006,2005,2004,2003,2002,2001,2000,1999,1998,1997,1996,1995,1994,1993,1992,1991,1990,1989,1988,1987,1986,1985,1984,1983,1982,1981,1980,1979,1978,1977,1976,1975,1974,1973,1972
This statistics in other country:
AfghanistanAlbaniaAlgeriaAndorraAngolaAntigua and BarbudaArab WorldArgentinaArmeniaArubaAustraliaAustriaAzerbaijanBahamas, TheBahrainBangladeshBarbadosBelarusBelgiumBelizeBeninBermudaBhutanBoliviaBosnia and HerzegovinaBotswanaBrazilBritish Virgin IslandsBrunei DarussalamBulgariaBurkina FasoBurundiCabo VerdeCambodiaCameroonCanadaCaribbean small statesCayman IslandsCentral African RepublicCentral Europe and the BalticsChadChileChinaColombiaComorosCongo, Dem. Rep.Congo, Rep.Costa RicaCote d'IvoireCroatiaCubaCuracaoCyprusCzech RepublicDenmarkDjiboutiDominicaDominican RepublicEarly-demographic dividendEast Asia & PacificEast Asia & Pacific (excluding high income)East Asia & Pacific (IDA & IBRD countries)EcuadorEgypt, Arab Rep.El SalvadorEquatorial GuineaEritreaEstoniaEthiopiaEuro areaEurope & Central AsiaEurope & Central Asia (excluding high income)Europe & Central Asia (IDA & IBRD countries)European UnionFijiFinlandFragile and conflict affected situationsFranceGabonGambia, TheGeorgiaGermanyGhanaGibraltarGreeceGrenadaGuatemalaGuineaGuinea-BissauGuyanaHaitiHeavily indebted poor countries (HIPC)High incomeHondurasHong Kong SAR, ChinaHungaryIBRD onlyIcelandIDA & IBRD totalIDA blendIDA onlyIDA totalIndiaIndonesiaIran, Islamic Rep.IraqIrelandIsraelItalyJamaicaJapanJordanKazakhstanKenyaKiribatiKorea, Dem. People’s Rep.Korea, Rep.KuwaitKyrgyz RepublicLao PDRLate-demographic dividendLatin America & Caribbean Latin America & Caribbean (excluding high income)Latin America & the Caribbean (IDA & IBRD countries)LatviaLeast developed countries: UN classificationLebanonLesothoLiberiaLibyaLiechtensteinLithuaniaLow & middle incomeLow incomeLower middle incomeLuxembourgMacao SAR, ChinaMacedonia, FYRMadagascarMalawiMalaysiaMaldivesMaliMaltaMarshall IslandsMauritaniaMauritiusMexicoMicronesia, Fed. Sts.Middle East & North AfricaMiddle East & North Africa (excluding high income)Middle East & North Africa (IDA & IBRD countries)Middle incomeMoldovaMonacoMongoliaMontenegroMoroccoMozambiqueMyanmarNamibiaNauruNepalNetherlandsNew ZealandNicaraguaNigerNigeriaNorth AmericaNorwayOECD membersOmanOther small statesPacific island small statesPakistanPalauPanamaPapua New GuineaParaguayPeruPhilippinesPolandPortugalPost-demographic dividendPre-demographic dividendPuerto RicoQatarRomaniaRussian FederationRwandaSamoaSan MarinoSao Tome and PrincipeSaudi ArabiaSenegalSerbiaSeychellesSierra LeoneSingaporeSint Maarten (Dutch part)Slovak RepublicSloveniaSmall statesSolomon IslandsSomaliaSouth AfricaSouth AsiaSouth Asia (IDA & IBRD)South SudanSpainSri LankaSt. Kitts and NevisSt. LuciaSt. Vincent and the GrenadinesSub-Saharan Africa Sub-Saharan Africa (excluding high income)Sub-Saharan Africa (IDA & IBRD countries)SudanSurinameSwazilandSwedenSwitzerlandSyrian Arab RepublicTajikistanTanzaniaThailandTimor-LesteTogoTongaTrinidad and TobagoTunisiaTurkeyTurkmenistanTurks and Caicos IslandsTuvaluUgandaUkraineUnited Arab EmiratesUnited KingdomUnited StatesUpper middle incomeUruguayUzbekistanVanuatuVenezuela, RBVietnamWest Bank and GazaWorldYemen, Rep.ZambiaZimbabwe Timeline:
This timeline shows a graph from 1972 to 2015 of Algeria. No data until 1971. Number of actual observations by date: 44.
Source name:
World Development Indicators
Source organization:
United Nations Educational, Scientific, and Cultural Organization (UNESCO) Institute for Statistics.
Categories, topics:
Education, Gender
Last updated:
apr 23, 2017
Indicators value changes by year
Minimum:
37.513
jan 1, 1972
Maximum:
47.728
jan 1, 2015
At the date of observation
Value
Absolute change
Change from previous value
jan 1, 1972
37.513
+37.513
0.0%
jan 1, 1973
38.558
+1.044
2.78%
jan 1, 1974
39.069
+0.511
1.33%
jan 1, 1975
39.292
+0.223
0.57%
jan 1, 1976
39.588
+0.296
0.75%
jan 1, 1977
39.973
+0.385
0.97%
jan 1, 1978
40.558
+0.585
1.46%
jan 1, 1979
40.827
+0.269
0.66%
jan 1, 1980
41.313
+0.486
1.19%
jan 1, 1981
41.636
+0.323
0.78%
jan 1, 1982
41.924
+0.288
0.69%
jan 1, 1983
42.114
+0.189
0.45%
jan 1, 1984
42.417
+0.303
0.72%
jan 1, 1985
42.645
+0.227
0.54%
jan 1, 1986
43.021
+0.376
0.88%
jan 1, 1987
43.552
+0.531
1.23%
jan 1, 1988
43.998
+0.446
1.02%
jan 1, 1989
44.257
+0.26
0.59%
jan 1, 1990
44.521
+0.263
0.59%
jan 1, 1991
44.661
+0.141
0.32%
jan 1, 1992
44.83
+0.169
0.38%
jan 1, 1993
45.116
+0.286
0.64%
jan 1, 1994
45.345
+0.229
0.51%
jan 1, 1995
45.653
+0.308
0.68%
jan 1, 1996
45.868
+0.215
0.47%
jan 1, 1997
46.116
+0.248
0.54%
jan 1, 1998
46.296
+0.18
0.39%
jan 1, 1999
46.491
+0.195
0.42%
jan 1, 2000
46.646
+0.155
0.33%
jan 1, 2001
46.757
+0.111
0.24%
jan 1, 2002
46.815
+0.058
0.12%
jan 1, 2003
46.983
+0.168
0.36%
jan 1, 2004
46.96
-0.023
-0.05%
jan 1, 2005
47.018
+0.059
0.13%
jan 1, 2006
46.998
-0.021
-0.04%
jan 1, 2007
47.036
+0.038
0.08%
jan 1, 2008
47.236
+0.2
0.43%
jan 1, 2009
47.309
+0.072
0.15%
jan 1, 2010
47.287
-0.022
-0.05%
jan 1, 2011
47.335
+0.048
0.1%
jan 1, 2012
47.365
+0.03
0.06%
jan 1, 2013
47.545
+0.18
0.38%
jan 1, 2014
47.661
+0.116
0.24%
jan 1, 2015
47.728
+0.066
0.14%
Ranking of countries by current statistics by years


Comments: