29
/
en
AIzaSyAYiBZKx7MnpbEhh9jyipgxe19OcubqV5w
April 1, 2024
174708
Lao PDR
LAO
true
2
1
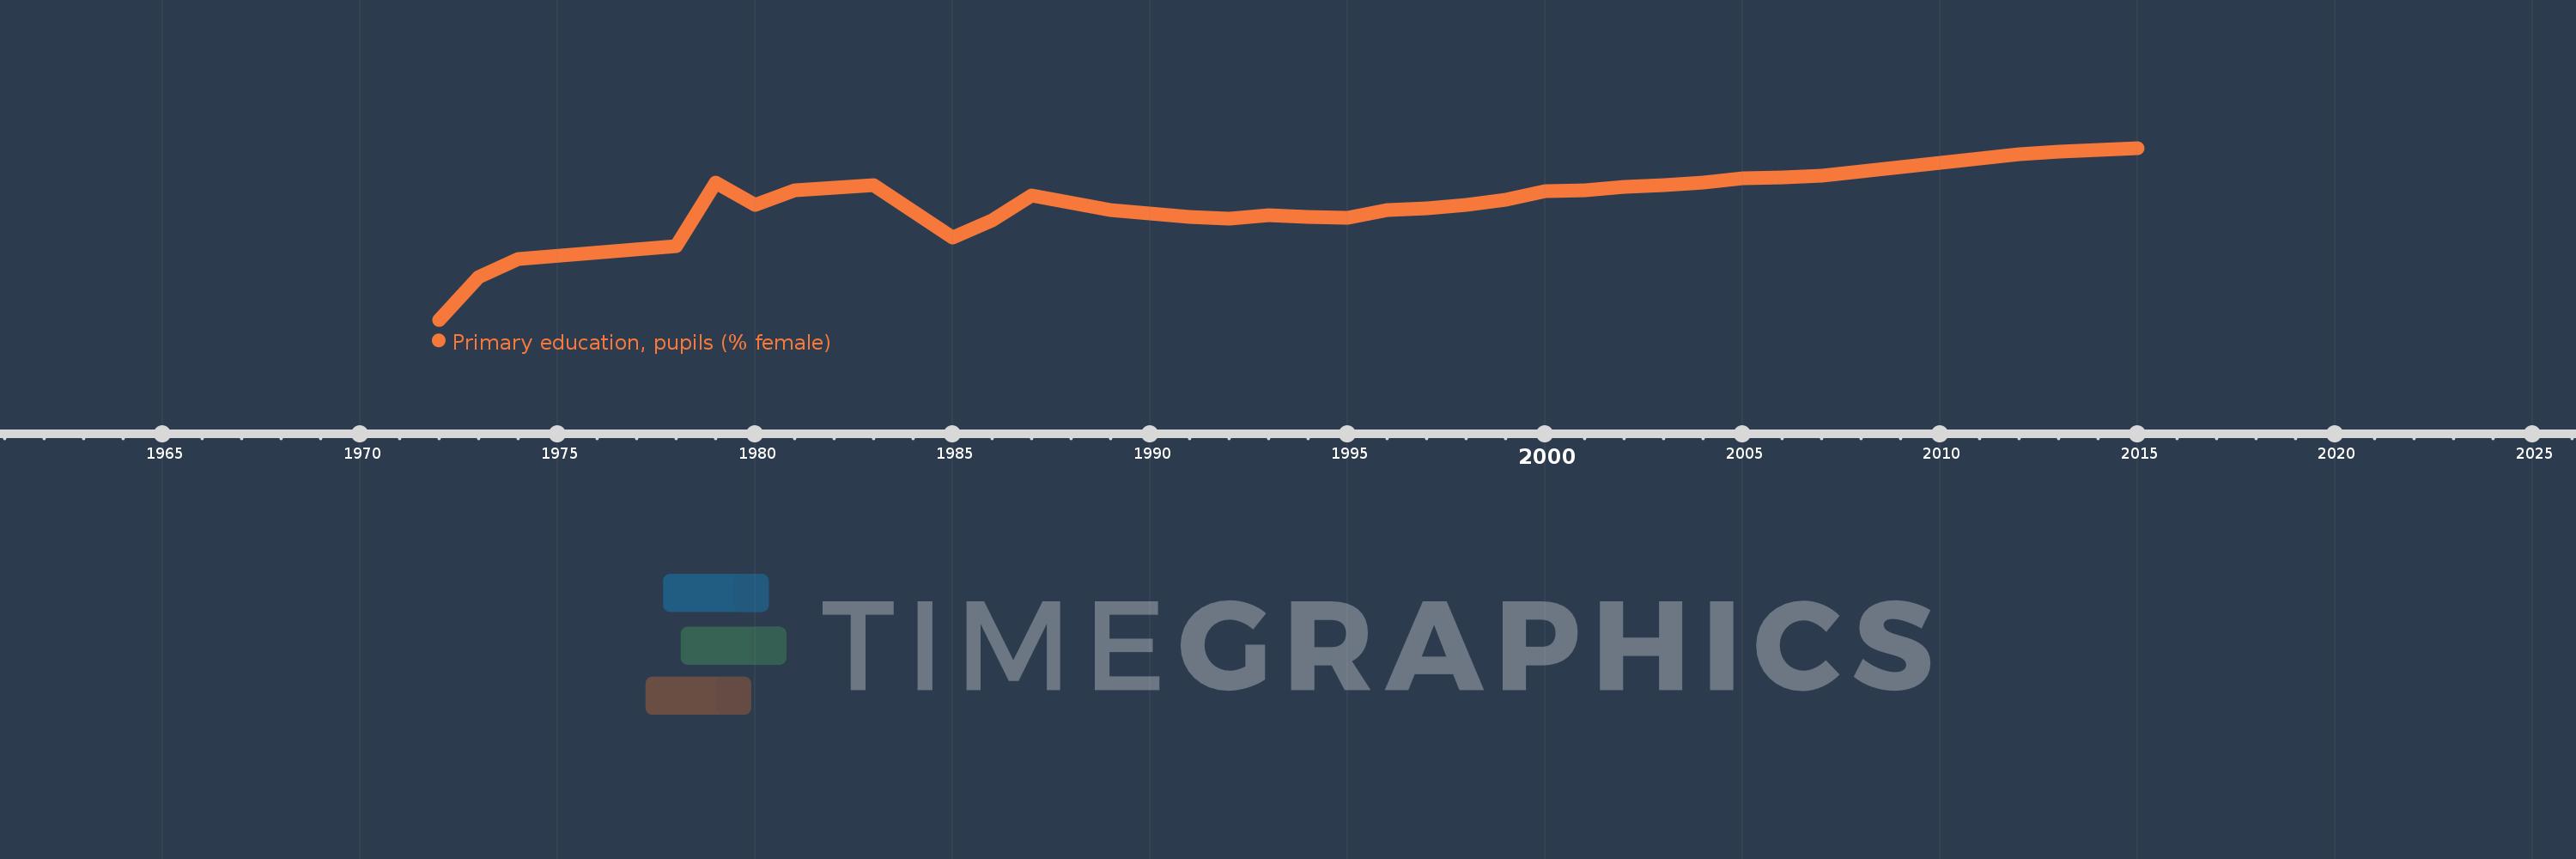
Primary education, pupils (% female)
2015,2014,2013,2012,2011,2010,2009,2008,2007,2006,2005,2004,2003,2002,2001,2000,1999,1998,1997,1996,1995,1994,1993,1992,1991,1989,1987,1986,1985,1983,1982,1981,1980,1979,1978,1974,1973,1972
This statistics in other country:
AfghanistanAlbaniaAlgeriaAndorraAngolaAntigua and BarbudaArab WorldArgentinaArmeniaArubaAustraliaAustriaAzerbaijanBahamas, TheBahrainBangladeshBarbadosBelarusBelgiumBelizeBeninBermudaBhutanBoliviaBosnia and HerzegovinaBotswanaBrazilBritish Virgin IslandsBrunei DarussalamBulgariaBurkina FasoBurundiCabo VerdeCambodiaCameroonCanadaCaribbean small statesCayman IslandsCentral African RepublicCentral Europe and the BalticsChadChileChinaColombiaComorosCongo, Dem. Rep.Congo, Rep.Costa RicaCote d'IvoireCroatiaCubaCuracaoCyprusCzech RepublicDenmarkDjiboutiDominicaDominican RepublicEarly-demographic dividendEast Asia & PacificEast Asia & Pacific (excluding high income)East Asia & Pacific (IDA & IBRD countries)EcuadorEgypt, Arab Rep.El SalvadorEquatorial GuineaEritreaEstoniaEthiopiaEuro areaEurope & Central AsiaEurope & Central Asia (excluding high income)Europe & Central Asia (IDA & IBRD countries)European UnionFijiFinlandFragile and conflict affected situationsFranceGabonGambia, TheGeorgiaGermanyGhanaGibraltarGreeceGrenadaGuatemalaGuineaGuinea-BissauGuyanaHaitiHeavily indebted poor countries (HIPC)High incomeHondurasHong Kong SAR, ChinaHungaryIBRD onlyIcelandIDA & IBRD totalIDA blendIDA onlyIDA totalIndiaIndonesiaIran, Islamic Rep.IraqIrelandIsraelItalyJamaicaJapanJordanKazakhstanKenyaKiribatiKorea, Dem. People’s Rep.Korea, Rep.KuwaitKyrgyz RepublicLao PDRLate-demographic dividendLatin America & Caribbean Latin America & Caribbean (excluding high income)Latin America & the Caribbean (IDA & IBRD countries)LatviaLeast developed countries: UN classificationLebanonLesothoLiberiaLibyaLiechtensteinLithuaniaLow & middle incomeLow incomeLower middle incomeLuxembourgMacao SAR, ChinaMacedonia, FYRMadagascarMalawiMalaysiaMaldivesMaliMaltaMarshall IslandsMauritaniaMauritiusMexicoMicronesia, Fed. Sts.Middle East & North AfricaMiddle East & North Africa (excluding high income)Middle East & North Africa (IDA & IBRD countries)Middle incomeMoldovaMonacoMongoliaMontenegroMoroccoMozambiqueMyanmarNamibiaNauruNepalNetherlandsNew ZealandNicaraguaNigerNigeriaNorth AmericaNorwayOECD membersOmanOther small statesPacific island small statesPakistanPalauPanamaPapua New GuineaParaguayPeruPhilippinesPolandPortugalPost-demographic dividendPre-demographic dividendPuerto RicoQatarRomaniaRussian FederationRwandaSamoaSan MarinoSao Tome and PrincipeSaudi ArabiaSenegalSerbiaSeychellesSierra LeoneSingaporeSint Maarten (Dutch part)Slovak RepublicSloveniaSmall statesSolomon IslandsSomaliaSouth AfricaSouth AsiaSouth Asia (IDA & IBRD)South SudanSpainSri LankaSt. Kitts and NevisSt. LuciaSt. Vincent and the GrenadinesSub-Saharan Africa Sub-Saharan Africa (excluding high income)Sub-Saharan Africa (IDA & IBRD countries)SudanSurinameSwazilandSwedenSwitzerlandSyrian Arab RepublicTajikistanTanzaniaThailandTimor-LesteTogoTongaTrinidad and TobagoTunisiaTurkeyTurkmenistanTurks and Caicos IslandsTuvaluUgandaUkraineUnited Arab EmiratesUnited KingdomUnited StatesUpper middle incomeUruguayUzbekistanVanuatuVenezuela, RBVietnamWest Bank and GazaWorldYemen, Rep.ZambiaZimbabwe Timeline:
This timeline shows a graph from 1972 to 2015 of Lao PDR. No data until 1971. Number of actual observations by date: 38.
Source name:
World Development Indicators
Source organization:
United Nations Educational, Scientific, and Cultural Organization (UNESCO) Institute for Statistics.
Categories, topics:
Education, Gender
Last updated:
apr 23, 2017
Indicators value changes by year
Minimum:
36.987
jan 1, 1972
Maximum:
47.839
jan 1, 2015
At the date of observation
Value
Absolute change
Change from previous value
jan 1, 1972
36.987
+36.987
0.0%
jan 1, 1973
39.683
+2.695
7.29%
jan 1, 1974
40.798
+1.116
2.81%
jan 1, 1978
41.658
+0.86
2.11%
jan 1, 1979
45.646
+3.988
9.57%
jan 1, 1980
44.229
-1.417
-3.11%
jan 1, 1981
45.183
+0.954
2.16%
jan 1, 1982
45.337
+0.154
0.34%
jan 1, 1983
45.5
+0.163
0.36%
jan 1, 1985
42.162
-3.338
-7.34%
jan 1, 1986
43.27
+1.108
2.63%
jan 1, 1987
44.863
+1.593
3.68%
jan 1, 1989
43.943
-0.921
-2.05%
jan 1, 1991
43.461
-0.481
-1.1%
jan 1, 1992
43.393
-0.068
-0.16%
jan 1, 1993
43.606
+0.213
0.49%
jan 1, 1994
43.504
-0.103
-0.24%
jan 1, 1995
43.44
-0.064
-0.15%
jan 1, 1996
43.918
+0.478
1.1%
jan 1, 1997
44.001
+0.083
0.19%
jan 1, 1998
44.268
+0.267
0.61%
jan 1, 1999
44.545
+0.277
0.63%
jan 1, 2000
45.109
+0.563
1.26%
jan 1, 2001
45.184
+0.075
0.17%
jan 1, 2002
45.371
+0.188
0.42%
jan 1, 2003
45.478
+0.106
0.23%
jan 1, 2004
45.649
+0.172
0.38%
jan 1, 2005
45.918
+0.269
0.59%
jan 1, 2006
45.979
+0.061
0.13%
jan 1, 2007
46.106
+0.127
0.28%
jan 1, 2008
46.361
+0.255
0.55%
jan 1, 2009
46.624
+0.263
0.57%
jan 1, 2010
46.927
+0.303
0.65%
jan 1, 2011
47.182
+0.255
0.54%
jan 1, 2012
47.444
+0.261
0.55%
jan 1, 2013
47.614
+0.17
0.36%
jan 1, 2014
47.733
+0.119
0.25%
jan 1, 2015
47.839
+0.106
0.22%
Ranking of countries by current statistics by years


Comments: