29
/
en
AIzaSyAYiBZKx7MnpbEhh9jyipgxe19OcubqV5w
April 1, 2024
125435
Egypt, Arab Rep.
EGY
true
2
1
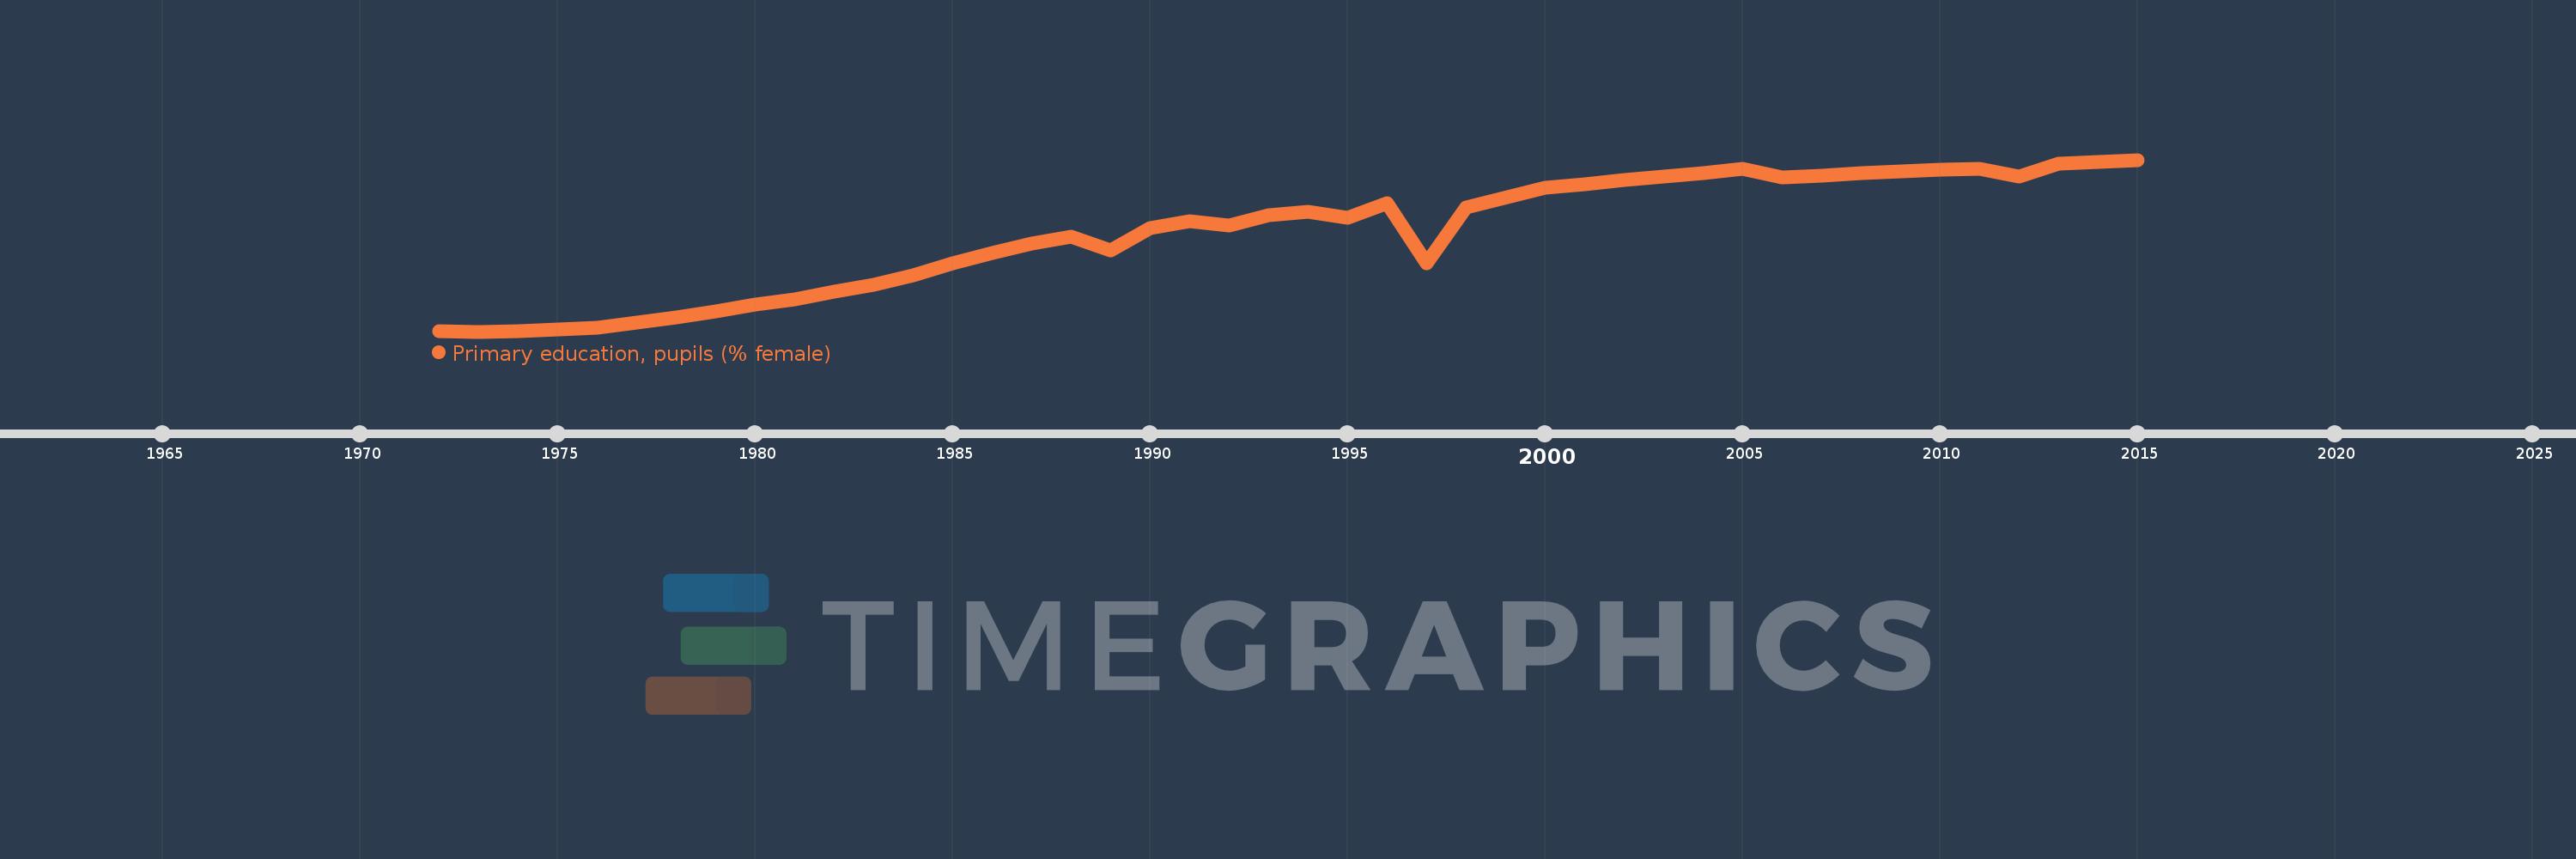
Primary education, pupils (% female)
2015,2014,2013,2012,2011,2010,2008,2007,2006,2005,2004,2003,2002,2001,2000,1998,1997,1996,1995,1994,1993,1992,1991,1990,1989,1988,1987,1986,1985,1984,1983,1982,1981,1980,1979,1978,1977,1976,1975,1974,1973,1972
This statistics in other country:
AfghanistanAlbaniaAlgeriaAndorraAngolaAntigua and BarbudaArab WorldArgentinaArmeniaArubaAustraliaAustriaAzerbaijanBahamas, TheBahrainBangladeshBarbadosBelarusBelgiumBelizeBeninBermudaBhutanBoliviaBosnia and HerzegovinaBotswanaBrazilBritish Virgin IslandsBrunei DarussalamBulgariaBurkina FasoBurundiCabo VerdeCambodiaCameroonCanadaCaribbean small statesCayman IslandsCentral African RepublicCentral Europe and the BalticsChadChileChinaColombiaComorosCongo, Dem. Rep.Congo, Rep.Costa RicaCote d'IvoireCroatiaCubaCuracaoCyprusCzech RepublicDenmarkDjiboutiDominicaDominican RepublicEarly-demographic dividendEast Asia & PacificEast Asia & Pacific (excluding high income)East Asia & Pacific (IDA & IBRD countries)EcuadorEgypt, Arab Rep.El SalvadorEquatorial GuineaEritreaEstoniaEthiopiaEuro areaEurope & Central AsiaEurope & Central Asia (excluding high income)Europe & Central Asia (IDA & IBRD countries)European UnionFijiFinlandFragile and conflict affected situationsFranceGabonGambia, TheGeorgiaGermanyGhanaGibraltarGreeceGrenadaGuatemalaGuineaGuinea-BissauGuyanaHaitiHeavily indebted poor countries (HIPC)High incomeHondurasHong Kong SAR, ChinaHungaryIBRD onlyIcelandIDA & IBRD totalIDA blendIDA onlyIDA totalIndiaIndonesiaIran, Islamic Rep.IraqIrelandIsraelItalyJamaicaJapanJordanKazakhstanKenyaKiribatiKorea, Dem. People’s Rep.Korea, Rep.KuwaitKyrgyz RepublicLao PDRLate-demographic dividendLatin America & Caribbean Latin America & Caribbean (excluding high income)Latin America & the Caribbean (IDA & IBRD countries)LatviaLeast developed countries: UN classificationLebanonLesothoLiberiaLibyaLiechtensteinLithuaniaLow & middle incomeLow incomeLower middle incomeLuxembourgMacao SAR, ChinaMacedonia, FYRMadagascarMalawiMalaysiaMaldivesMaliMaltaMarshall IslandsMauritaniaMauritiusMexicoMicronesia, Fed. Sts.Middle East & North AfricaMiddle East & North Africa (excluding high income)Middle East & North Africa (IDA & IBRD countries)Middle incomeMoldovaMonacoMongoliaMontenegroMoroccoMozambiqueMyanmarNamibiaNauruNepalNetherlandsNew ZealandNicaraguaNigerNigeriaNorth AmericaNorwayOECD membersOmanOther small statesPacific island small statesPakistanPalauPanamaPapua New GuineaParaguayPeruPhilippinesPolandPortugalPost-demographic dividendPre-demographic dividendPuerto RicoQatarRomaniaRussian FederationRwandaSamoaSan MarinoSao Tome and PrincipeSaudi ArabiaSenegalSerbiaSeychellesSierra LeoneSingaporeSint Maarten (Dutch part)Slovak RepublicSloveniaSmall statesSolomon IslandsSomaliaSouth AfricaSouth AsiaSouth Asia (IDA & IBRD)South SudanSpainSri LankaSt. Kitts and NevisSt. LuciaSt. Vincent and the GrenadinesSub-Saharan Africa Sub-Saharan Africa (excluding high income)Sub-Saharan Africa (IDA & IBRD countries)SudanSurinameSwazilandSwedenSwitzerlandSyrian Arab RepublicTajikistanTanzaniaThailandTimor-LesteTogoTongaTrinidad and TobagoTunisiaTurkeyTurkmenistanTurks and Caicos IslandsTuvaluUgandaUkraineUnited Arab EmiratesUnited KingdomUnited StatesUpper middle incomeUruguayUzbekistanVanuatuVenezuela, RBVietnamWest Bank and GazaWorldYemen, Rep.ZambiaZimbabwe Timeline:
This timeline shows a graph from 1972 to 2015 of Egypt, Arab Rep.. No data until 1971. Number of actual observations by date: 42.
Source name:
World Development Indicators
Source organization:
United Nations Educational, Scientific, and Cultural Organization (UNESCO) Institute for Statistics.
Categories, topics:
Education, Gender
Last updated:
apr 23, 2017
Indicators value changes by year
Minimum:
37.757
jan 1, 1973
Maximum:
48.421
jan 1, 2015
At the date of observation
Value
Absolute change
Change from previous value
jan 1, 1972
37.768
+37.768
0.0%
jan 1, 1973
37.757
-0.011
-0.03%
jan 1, 1974
37.761
+0.004
0.01%
jan 1, 1975
37.916
+0.155
0.41%
jan 1, 1976
37.976
+0.06
0.16%
jan 1, 1977
38.305
+0.329
0.87%
jan 1, 1978
38.626
+0.321
0.84%
jan 1, 1979
39.023
+0.398
1.03%
jan 1, 1980
39.431
+0.408
1.04%
jan 1, 1981
39.752
+0.321
0.81%
jan 1, 1982
40.232
+0.48
1.21%
jan 1, 1983
40.684
+0.452
1.12%
jan 1, 1984
41.264
+0.58
1.43%
jan 1, 1985
41.985
+0.721
1.75%
jan 1, 1986
42.644
+0.659
1.57%
jan 1, 1987
43.2
+0.557
1.31%
jan 1, 1988
43.654
+0.453
1.05%
jan 1, 1989
42.77
-0.884
-2.02%
jan 1, 1990
44.181
+1.411
3.3%
jan 1, 1991
44.611
+0.43
0.97%
jan 1, 1992
44.351
-0.26
-0.58%
jan 1, 1993
44.984
+0.633
1.43%
jan 1, 1994
45.199
+0.214
0.48%
jan 1, 1995
44.797
-0.402
-0.89%
jan 1, 1996
45.737
+0.941
2.1%
jan 1, 1997
41.991
-3.746
-8.19%
jan 1, 1998
45.444
+3.453
8.22%
jan 1, 2000
46.69
+1.246
2.74%
jan 1, 2001
46.907
+0.217
0.47%
jan 1, 2002
47.158
+0.251
0.54%
jan 1, 2003
47.371
+0.213
0.45%
jan 1, 2004
47.608
+0.237
0.5%
jan 1, 2005
47.873
+0.265
0.56%
jan 1, 2006
47.336
-0.537
-1.12%
jan 1, 2007
47.409
+0.073
0.15%
jan 1, 2008
47.596
+0.188
0.4%
jan 1, 2010
47.792
+0.195
0.41%
jan 1, 2011
47.853
+0.062
0.13%
jan 1, 2012
47.403
-0.451
-0.94%
jan 1, 2013
48.188
+0.785
1.66%
jan 1, 2014
48.285
+0.097
0.2%
jan 1, 2015
48.421
+0.136
0.28%
Ranking of countries by current statistics by years


Comments: