29
/
en
AIzaSyAYiBZKx7MnpbEhh9jyipgxe19OcubqV5w
April 1, 2024
45589
Low & middle income
LMY
false
2
1
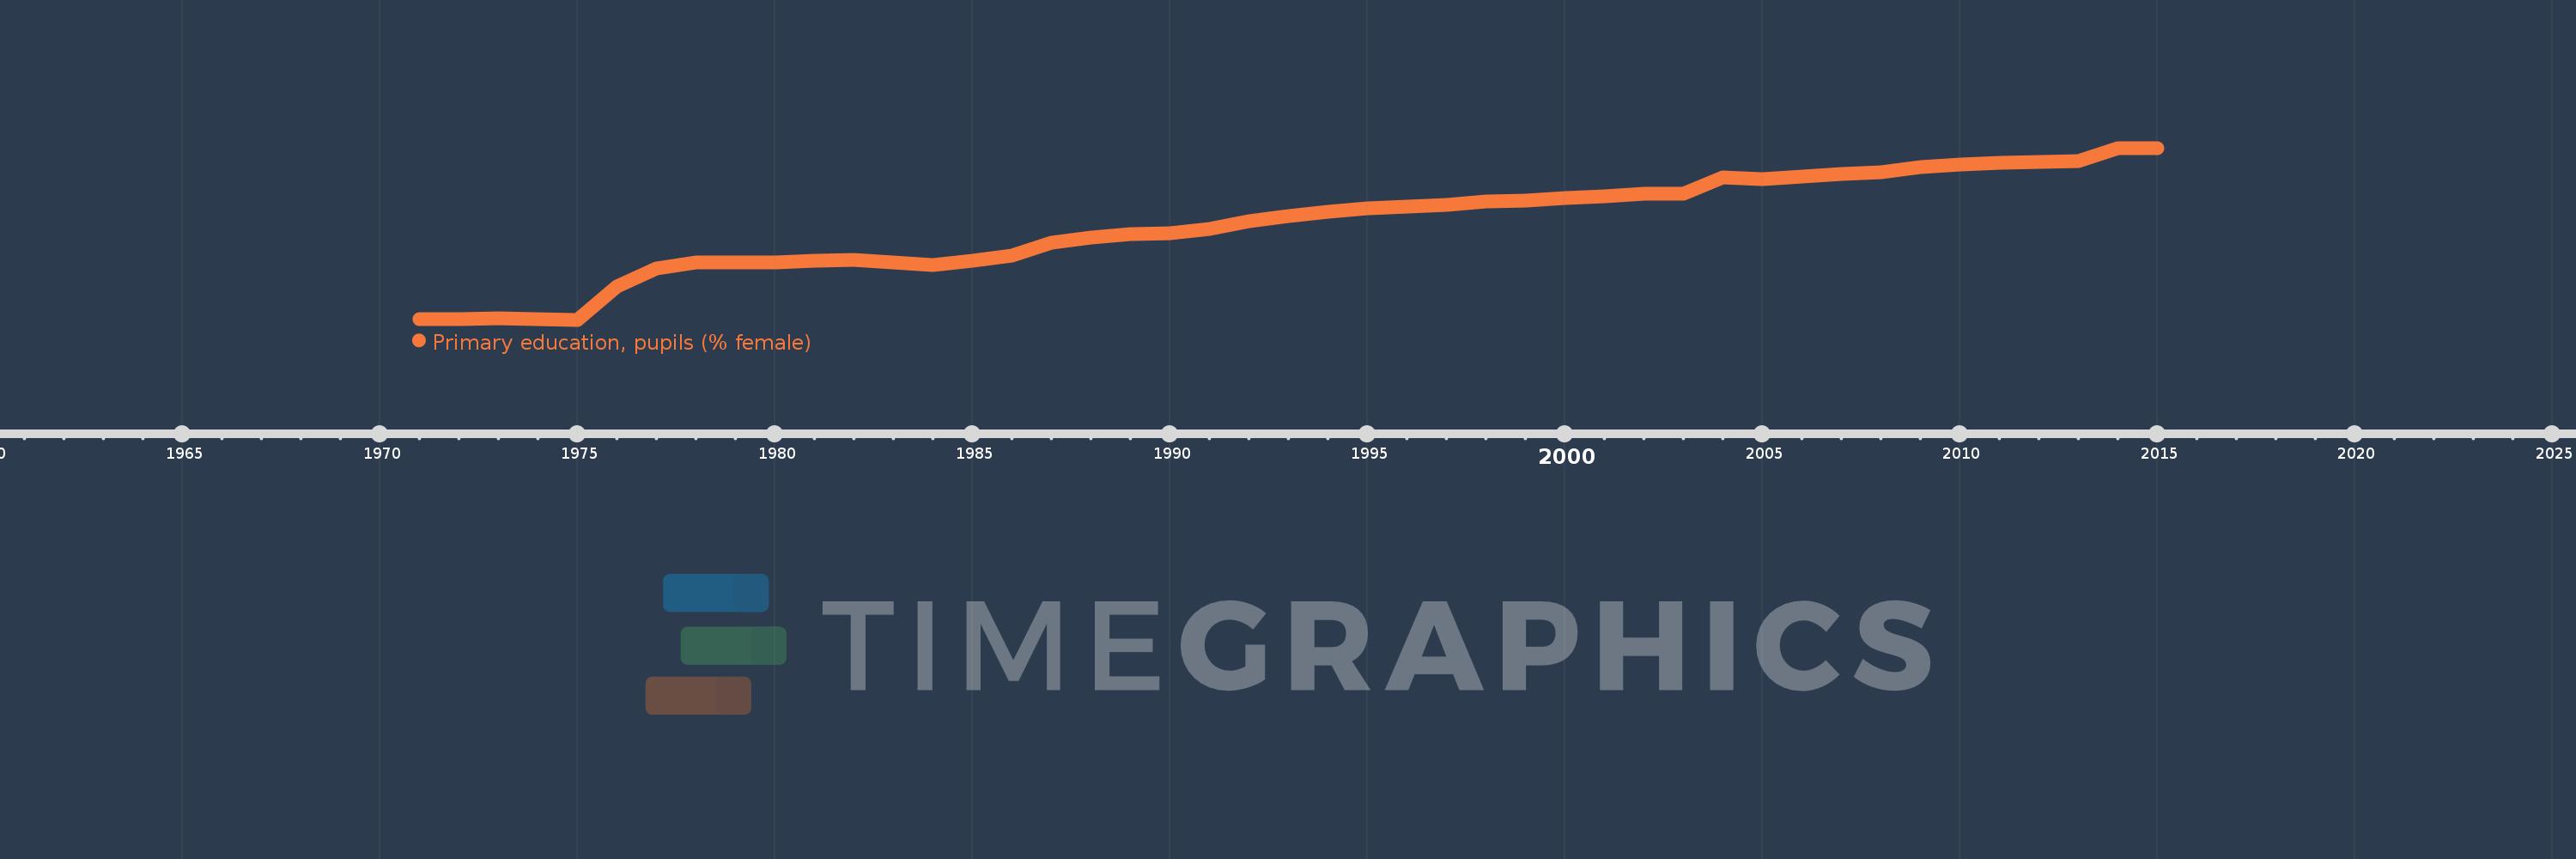
Primary education, pupils (% female)
2015,2014,2013,2012,2011,2010,2009,2008,2007,2006,2005,2004,2003,2002,2001,2000,1999,1998,1997,1996,1995,1994,1993,1992,1991,1990,1989,1988,1987,1986,1985,1984,1983,1982,1981,1980,1979,1978,1977,1976,1975,1974,1973,1972,1971
This statistics in other country:
AfghanistanAlbaniaAlgeriaAndorraAngolaAntigua and BarbudaArab WorldArgentinaArmeniaArubaAustraliaAustriaAzerbaijanBahamas, TheBahrainBangladeshBarbadosBelarusBelgiumBelizeBeninBermudaBhutanBoliviaBosnia and HerzegovinaBotswanaBrazilBritish Virgin IslandsBrunei DarussalamBulgariaBurkina FasoBurundiCabo VerdeCambodiaCameroonCanadaCaribbean small statesCayman IslandsCentral African RepublicCentral Europe and the BalticsChadChileChinaColombiaComorosCongo, Dem. Rep.Congo, Rep.Costa RicaCote d'IvoireCroatiaCubaCuracaoCyprusCzech RepublicDenmarkDjiboutiDominicaDominican RepublicEarly-demographic dividendEast Asia & PacificEast Asia & Pacific (excluding high income)East Asia & Pacific (IDA & IBRD countries)EcuadorEgypt, Arab Rep.El SalvadorEquatorial GuineaEritreaEstoniaEthiopiaEuro areaEurope & Central AsiaEurope & Central Asia (excluding high income)Europe & Central Asia (IDA & IBRD countries)European UnionFijiFinlandFragile and conflict affected situationsFranceGabonGambia, TheGeorgiaGermanyGhanaGibraltarGreeceGrenadaGuatemalaGuineaGuinea-BissauGuyanaHaitiHeavily indebted poor countries (HIPC)High incomeHondurasHong Kong SAR, ChinaHungaryIBRD onlyIcelandIDA & IBRD totalIDA blendIDA onlyIDA totalIndiaIndonesiaIran, Islamic Rep.IraqIrelandIsraelItalyJamaicaJapanJordanKazakhstanKenyaKiribatiKorea, Dem. People’s Rep.Korea, Rep.KuwaitKyrgyz RepublicLao PDRLate-demographic dividendLatin America & Caribbean Latin America & Caribbean (excluding high income)Latin America & the Caribbean (IDA & IBRD countries)LatviaLeast developed countries: UN classificationLebanonLesothoLiberiaLibyaLiechtensteinLithuaniaLow & middle incomeLow incomeLower middle incomeLuxembourgMacao SAR, ChinaMacedonia, FYRMadagascarMalawiMalaysiaMaldivesMaliMaltaMarshall IslandsMauritaniaMauritiusMexicoMicronesia, Fed. Sts.Middle East & North AfricaMiddle East & North Africa (excluding high income)Middle East & North Africa (IDA & IBRD countries)Middle incomeMoldovaMonacoMongoliaMontenegroMoroccoMozambiqueMyanmarNamibiaNauruNepalNetherlandsNew ZealandNicaraguaNigerNigeriaNorth AmericaNorwayOECD membersOmanOther small statesPacific island small statesPakistanPalauPanamaPapua New GuineaParaguayPeruPhilippinesPolandPortugalPost-demographic dividendPre-demographic dividendPuerto RicoQatarRomaniaRussian FederationRwandaSamoaSan MarinoSao Tome and PrincipeSaudi ArabiaSenegalSerbiaSeychellesSierra LeoneSingaporeSint Maarten (Dutch part)Slovak RepublicSloveniaSmall statesSolomon IslandsSomaliaSouth AfricaSouth AsiaSouth Asia (IDA & IBRD)South SudanSpainSri LankaSt. Kitts and NevisSt. LuciaSt. Vincent and the GrenadinesSub-Saharan Africa Sub-Saharan Africa (excluding high income)Sub-Saharan Africa (IDA & IBRD countries)SudanSurinameSwazilandSwedenSwitzerlandSyrian Arab RepublicTajikistanTanzaniaThailandTimor-LesteTogoTongaTrinidad and TobagoTunisiaTurkeyTurkmenistanTurks and Caicos IslandsTuvaluUgandaUkraineUnited Arab EmiratesUnited KingdomUnited StatesUpper middle incomeUruguayUzbekistanVanuatuVenezuela, RBVietnamWest Bank and GazaWorldYemen, Rep.ZambiaZimbabwe Timeline:
This timeline shows a graph from 1971 to 2015 of Low & middle income. No data until 1970. Number of actual observations by date: 45.
Source name:
World Development Indicators
Source organization:
United Nations Educational, Scientific, and Cultural Organization (UNESCO) Institute for Statistics.
Categories, topics:
Education, Gender
Last updated:
apr 23, 2017
Indicators value changes by year
Maximum:
48.055
jan 1, 2014
At the date of observation
Value
Absolute change
Change from previous value
jan 1, 1971
42.04
+42.04
0.0%
jan 1, 1972
42.027
-0.013
-0.03%
jan 1, 1973
42.065
+0.039
0.09%
jan 1, 1974
42.05
-0.015
-0.04%
jan 1, 1975
42.02
-0.03
-0.07%
jan 1, 1976
43.18
+1.16
2.76%
jan 1, 1977
43.826
+0.647
1.5%
jan 1, 1978
44.035
+0.208
0.48%
jan 1, 1979
44.027
-0.008
-0.02%
jan 1, 1980
44.045
+0.018
0.04%
jan 1, 1981
44.106
+0.061
0.14%
jan 1, 1982
44.118
+0.012
0.03%
jan 1, 1983
44.047
-0.071
-0.16%
jan 1, 1984
43.956
-0.09
-0.21%
jan 1, 1985
44.105
+0.149
0.34%
jan 1, 1986
44.271
+0.166
0.38%
jan 1, 1987
44.72
+0.449
1.01%
jan 1, 1988
44.909
+0.189
0.42%
jan 1, 1989
45.016
+0.107
0.24%
jan 1, 1990
45.07
+0.054
0.12%
jan 1, 1991
45.215
+0.145
0.32%
jan 1, 1992
45.473
+0.258
0.57%
jan 1, 1993
45.659
+0.186
0.41%
jan 1, 1994
45.823
+0.164
0.36%
jan 1, 1995
45.928
+0.106
0.23%
jan 1, 1996
45.987
+0.058
0.13%
jan 1, 1997
46.045
+0.059
0.13%
jan 1, 1998
46.178
+0.133
0.29%
jan 1, 1999
46.215
+0.037
0.08%
jan 1, 2000
46.304
+0.088
0.19%
jan 1, 2001
46.346
+0.042
0.09%
jan 1, 2002
46.434
+0.088
0.19%
jan 1, 2003
46.442
+0.008
0.02%
jan 1, 2004
47.01
+0.567
1.22%
jan 1, 2005
46.973
-0.037
-0.08%
jan 1, 2006
47.045
+0.072
0.15%
jan 1, 2007
47.126
+0.081
0.17%
jan 1, 2008
47.192
+0.065
0.14%
jan 1, 2009
47.383
+0.191
0.41%
jan 1, 2010
47.482
+0.099
0.21%
jan 1, 2011
47.548
+0.066
0.14%
jan 1, 2012
47.556
+0.008
0.02%
jan 1, 2013
47.594
+0.038
0.08%
jan 1, 2014
48.055
+0.461
0.97%
jan 1, 2015
48.036
-0.018
-0.04%
Ranking of countries by current statistics by years


Comments: