29
/
en
AIzaSyAYiBZKx7MnpbEhh9jyipgxe19OcubqV5w
April 1, 2024
191830
Malta
MLT
true
2
1
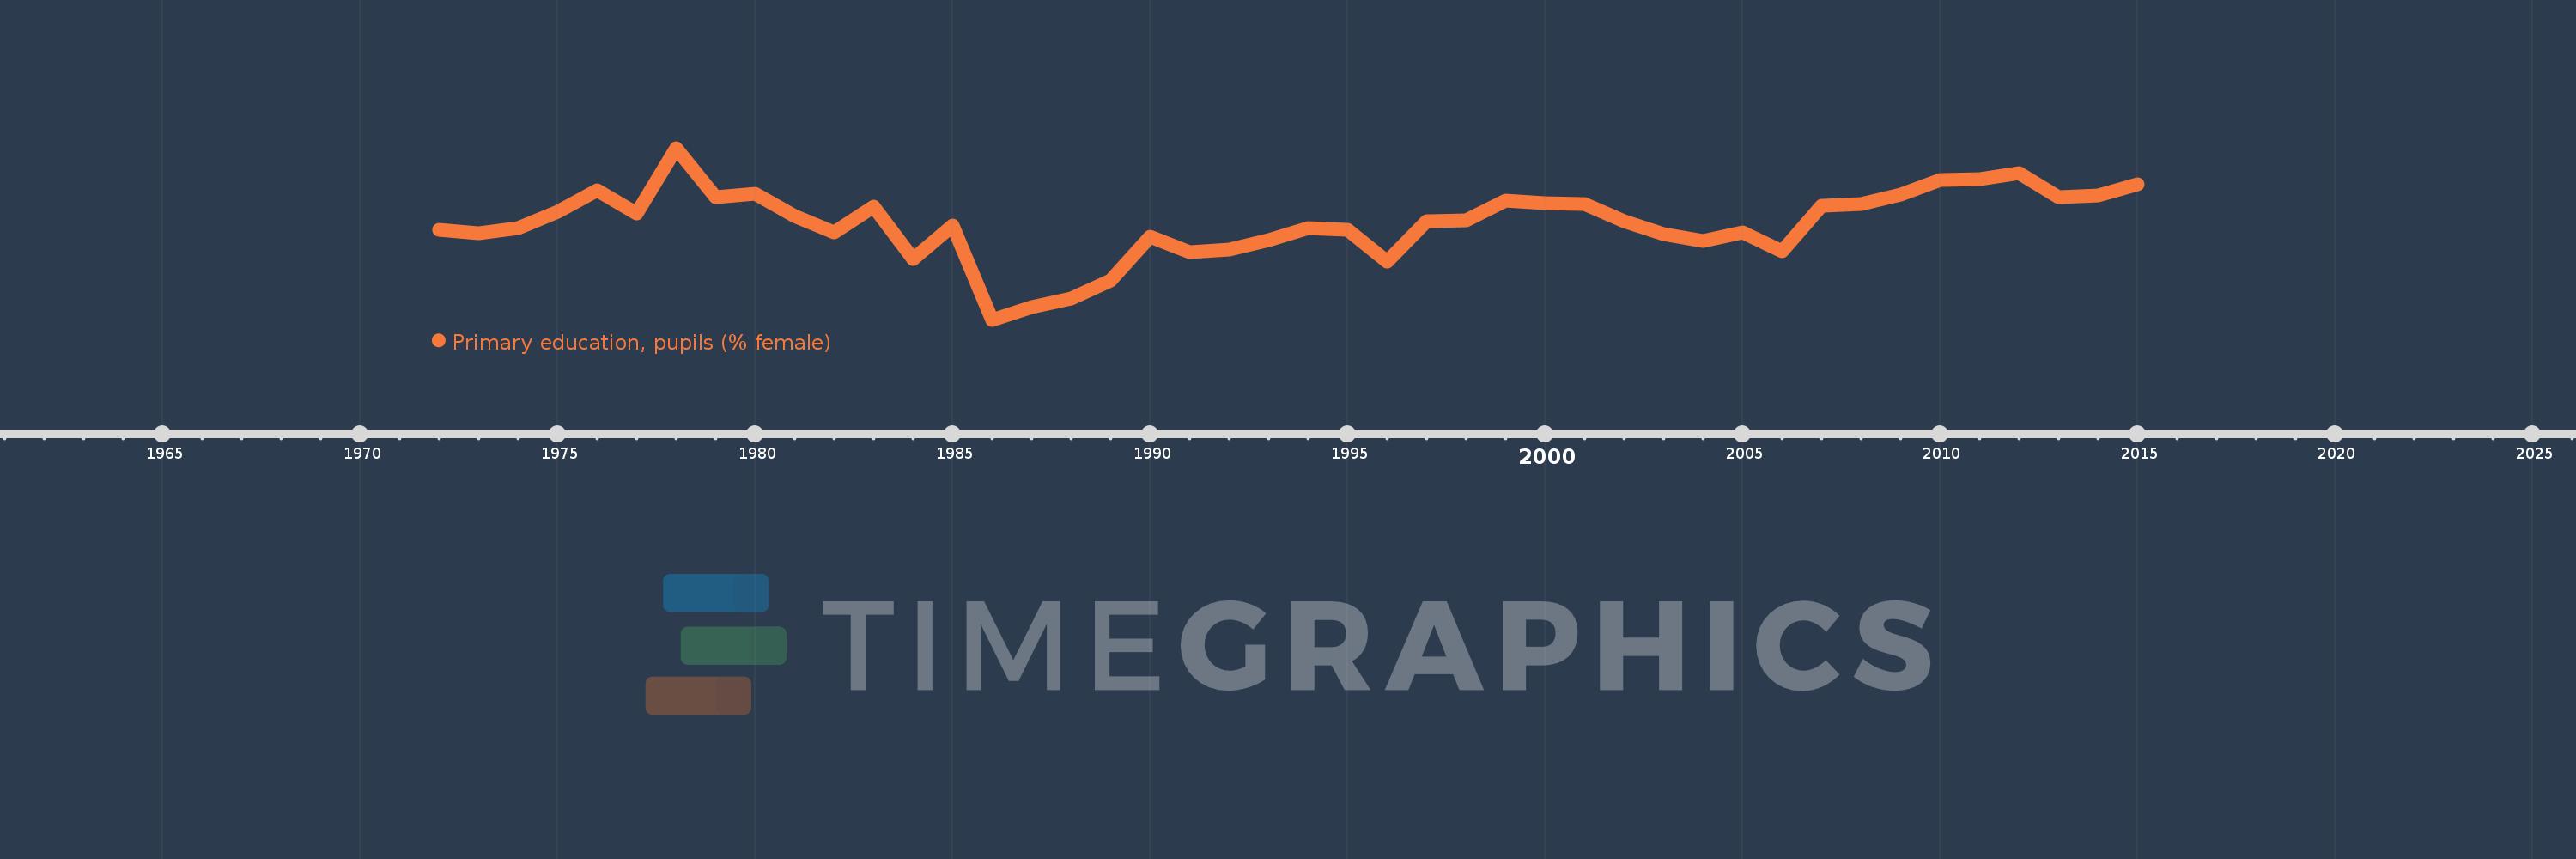
Primary education, pupils (% female)
2015,2014,2013,2012,2011,2010,2009,2008,2007,2006,2005,2004,2003,2002,2001,2000,1999,1998,1997,1996,1995,1994,1993,1992,1991,1990,1989,1988,1987,1986,1985,1984,1983,1982,1981,1980,1979,1978,1977,1976,1975,1974,1973,1972
This statistics in other country:
AfghanistanAlbaniaAlgeriaAndorraAngolaAntigua and BarbudaArab WorldArgentinaArmeniaArubaAustraliaAustriaAzerbaijanBahamas, TheBahrainBangladeshBarbadosBelarusBelgiumBelizeBeninBermudaBhutanBoliviaBosnia and HerzegovinaBotswanaBrazilBritish Virgin IslandsBrunei DarussalamBulgariaBurkina FasoBurundiCabo VerdeCambodiaCameroonCanadaCaribbean small statesCayman IslandsCentral African RepublicCentral Europe and the BalticsChadChileChinaColombiaComorosCongo, Dem. Rep.Congo, Rep.Costa RicaCote d'IvoireCroatiaCubaCuracaoCyprusCzech RepublicDenmarkDjiboutiDominicaDominican RepublicEarly-demographic dividendEast Asia & PacificEast Asia & Pacific (excluding high income)East Asia & Pacific (IDA & IBRD countries)EcuadorEgypt, Arab Rep.El SalvadorEquatorial GuineaEritreaEstoniaEthiopiaEuro areaEurope & Central AsiaEurope & Central Asia (excluding high income)Europe & Central Asia (IDA & IBRD countries)European UnionFijiFinlandFragile and conflict affected situationsFranceGabonGambia, TheGeorgiaGermanyGhanaGibraltarGreeceGrenadaGuatemalaGuineaGuinea-BissauGuyanaHaitiHeavily indebted poor countries (HIPC)High incomeHondurasHong Kong SAR, ChinaHungaryIBRD onlyIcelandIDA & IBRD totalIDA blendIDA onlyIDA totalIndiaIndonesiaIran, Islamic Rep.IraqIrelandIsraelItalyJamaicaJapanJordanKazakhstanKenyaKiribatiKorea, Dem. People’s Rep.Korea, Rep.KuwaitKyrgyz RepublicLao PDRLate-demographic dividendLatin America & Caribbean Latin America & Caribbean (excluding high income)Latin America & the Caribbean (IDA & IBRD countries)LatviaLeast developed countries: UN classificationLebanonLesothoLiberiaLibyaLiechtensteinLithuaniaLow & middle incomeLow incomeLower middle incomeLuxembourgMacao SAR, ChinaMacedonia, FYRMadagascarMalawiMalaysiaMaldivesMaliMaltaMarshall IslandsMauritaniaMauritiusMexicoMicronesia, Fed. Sts.Middle East & North AfricaMiddle East & North Africa (excluding high income)Middle East & North Africa (IDA & IBRD countries)Middle incomeMoldovaMonacoMongoliaMontenegroMoroccoMozambiqueMyanmarNamibiaNauruNepalNetherlandsNew ZealandNicaraguaNigerNigeriaNorth AmericaNorwayOECD membersOmanOther small statesPacific island small statesPakistanPalauPanamaPapua New GuineaParaguayPeruPhilippinesPolandPortugalPost-demographic dividendPre-demographic dividendPuerto RicoQatarRomaniaRussian FederationRwandaSamoaSan MarinoSao Tome and PrincipeSaudi ArabiaSenegalSerbiaSeychellesSierra LeoneSingaporeSint Maarten (Dutch part)Slovak RepublicSloveniaSmall statesSolomon IslandsSomaliaSouth AfricaSouth AsiaSouth Asia (IDA & IBRD)South SudanSpainSri LankaSt. Kitts and NevisSt. LuciaSt. Vincent and the GrenadinesSub-Saharan Africa Sub-Saharan Africa (excluding high income)Sub-Saharan Africa (IDA & IBRD countries)SudanSurinameSwazilandSwedenSwitzerlandSyrian Arab RepublicTajikistanTanzaniaThailandTimor-LesteTogoTongaTrinidad and TobagoTunisiaTurkeyTurkmenistanTurks and Caicos IslandsTuvaluUgandaUkraineUnited Arab EmiratesUnited KingdomUnited StatesUpper middle incomeUruguayUzbekistanVanuatuVenezuela, RBVietnamWest Bank and GazaWorldYemen, Rep.ZambiaZimbabwe Timeline:
This timeline shows a graph from 1972 to 2015 of Malta. No data until 1971. Number of actual observations by date: 44.
Source name:
World Development Indicators
Source organization:
United Nations Educational, Scientific, and Cultural Organization (UNESCO) Institute for Statistics.
Categories, topics:
Education, Gender
Last updated:
apr 23, 2017
Indicators value changes by year
Minimum:
47.031
jan 1, 1986
Maximum:
49.383
jan 1, 1978
At the date of observation
Value
Absolute change
Change from previous value
jan 1, 1972
48.267
+48.267
0.0%
jan 1, 1973
48.212
-0.055
-0.11%
jan 1, 1974
48.285
+0.073
0.15%
jan 1, 1975
48.515
+0.23
0.48%
jan 1, 1976
48.803
+0.287
0.59%
jan 1, 1977
48.485
-0.318
-0.65%
jan 1, 1978
49.383
+0.898
1.85%
jan 1, 1979
48.704
-0.679
-1.37%
jan 1, 1980
48.762
+0.058
0.12%
jan 1, 1981
48.456
-0.306
-0.63%
jan 1, 1982
48.223
-0.233
-0.48%
jan 1, 1983
48.585
+0.362
0.75%
jan 1, 1984
47.859
-0.726
-1.49%
jan 1, 1985
48.318
+0.46
0.96%
jan 1, 1986
47.031
-1.288
-2.67%
jan 1, 1987
47.208
+0.177
0.38%
jan 1, 1988
47.327
+0.119
0.25%
jan 1, 1989
47.566
+0.239
0.51%
jan 1, 1990
48.168
+0.602
1.26%
jan 1, 1991
47.955
-0.213
-0.44%
jan 1, 1992
47.99
+0.036
0.07%
jan 1, 1993
48.119
+0.129
0.27%
jan 1, 1994
48.29
+0.17
0.35%
jan 1, 1995
48.261
-0.029
-0.06%
jan 1, 1996
47.822
-0.439
-0.91%
jan 1, 1997
48.385
+0.564
1.18%
jan 1, 1998
48.386
+0.0
0.0%
jan 1, 1999
48.663
+0.277
0.57%
jan 1, 2000
48.625
-0.038
-0.08%
jan 1, 2001
48.615
-0.01
-0.02%
jan 1, 2002
48.381
-0.234
-0.48%
jan 1, 2003
48.204
-0.176
-0.36%
jan 1, 2004
48.111
-0.093
-0.19%
jan 1, 2005
48.223
+0.112
0.23%
jan 1, 2006
47.963
-0.26
-0.54%
jan 1, 2007
48.589
+0.627
1.31%
jan 1, 2008
48.617
+0.028
0.06%
jan 1, 2009
48.745
+0.128
0.26%
jan 1, 2010
48.946
+0.201
0.41%
jan 1, 2011
48.957
+0.011
0.02%
jan 1, 2012
49.034
+0.077
0.16%
jan 1, 2013
48.704
-0.331
-0.67%
jan 1, 2014
48.738
+0.034
0.07%
jan 1, 2015
48.891
+0.153
0.31%
Ranking of countries by current statistics by years


Comments: