29
/
en
AIzaSyAYiBZKx7MnpbEhh9jyipgxe19OcubqV5w
April 1, 2024
151959
Hong Kong SAR, China
HKG
true
2
1
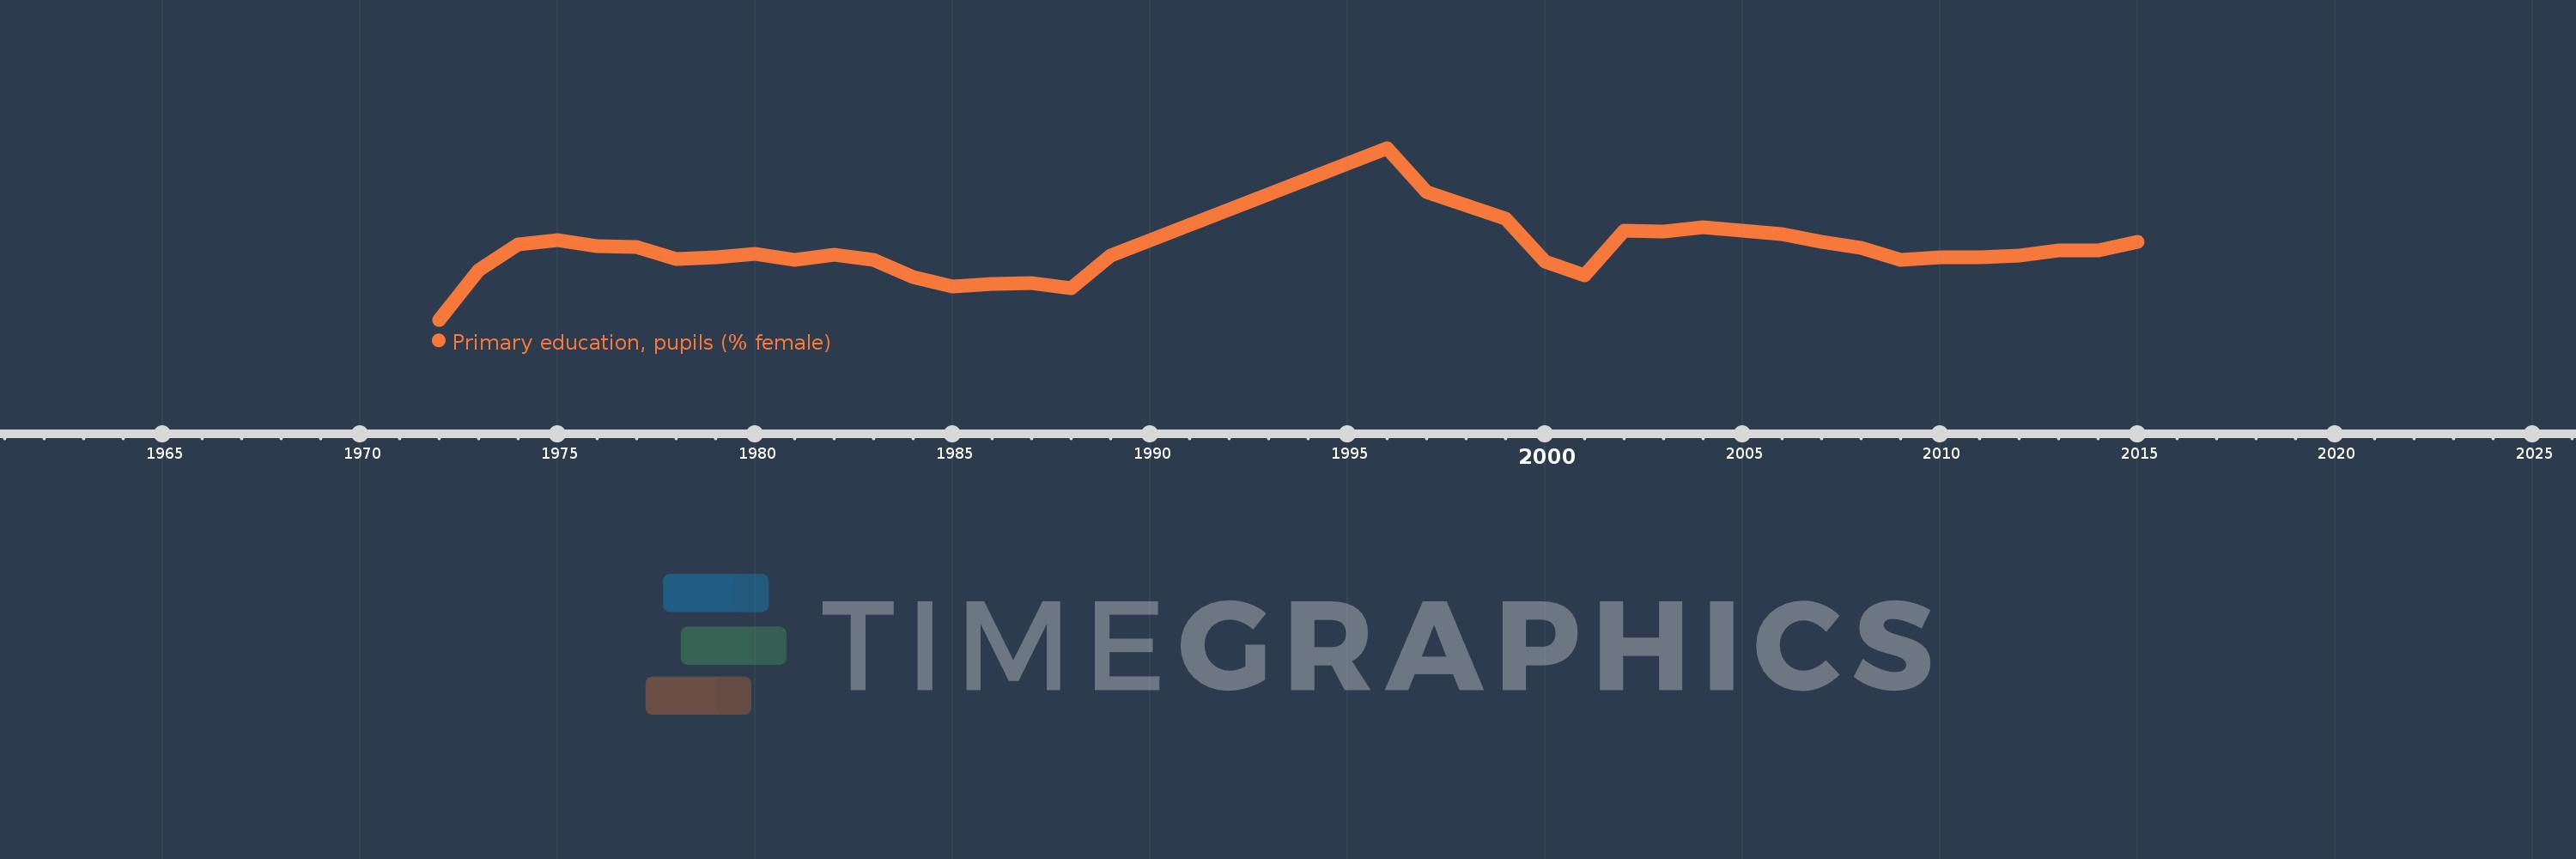
Primary education, pupils (% female)
2015,2014,2013,2012,2011,2010,2009,2008,2007,2006,2005,2004,2003,2002,2001,2000,1999,1997,1996,1989,1988,1987,1986,1985,1984,1983,1982,1981,1980,1979,1978,1977,1976,1975,1974,1973,1972
This statistics in other country:
AfghanistanAlbaniaAlgeriaAndorraAngolaAntigua and BarbudaArab WorldArgentinaArmeniaArubaAustraliaAustriaAzerbaijanBahamas, TheBahrainBangladeshBarbadosBelarusBelgiumBelizeBeninBermudaBhutanBoliviaBosnia and HerzegovinaBotswanaBrazilBritish Virgin IslandsBrunei DarussalamBulgariaBurkina FasoBurundiCabo VerdeCambodiaCameroonCanadaCaribbean small statesCayman IslandsCentral African RepublicCentral Europe and the BalticsChadChileChinaColombiaComorosCongo, Dem. Rep.Congo, Rep.Costa RicaCote d'IvoireCroatiaCubaCuracaoCyprusCzech RepublicDenmarkDjiboutiDominicaDominican RepublicEarly-demographic dividendEast Asia & PacificEast Asia & Pacific (excluding high income)East Asia & Pacific (IDA & IBRD countries)EcuadorEgypt, Arab Rep.El SalvadorEquatorial GuineaEritreaEstoniaEthiopiaEuro areaEurope & Central AsiaEurope & Central Asia (excluding high income)Europe & Central Asia (IDA & IBRD countries)European UnionFijiFinlandFragile and conflict affected situationsFranceGabonGambia, TheGeorgiaGermanyGhanaGibraltarGreeceGrenadaGuatemalaGuineaGuinea-BissauGuyanaHaitiHeavily indebted poor countries (HIPC)High incomeHondurasHong Kong SAR, ChinaHungaryIBRD onlyIcelandIDA & IBRD totalIDA blendIDA onlyIDA totalIndiaIndonesiaIran, Islamic Rep.IraqIrelandIsraelItalyJamaicaJapanJordanKazakhstanKenyaKiribatiKorea, Dem. People’s Rep.Korea, Rep.KuwaitKyrgyz RepublicLao PDRLate-demographic dividendLatin America & Caribbean Latin America & Caribbean (excluding high income)Latin America & the Caribbean (IDA & IBRD countries)LatviaLeast developed countries: UN classificationLebanonLesothoLiberiaLibyaLiechtensteinLithuaniaLow & middle incomeLow incomeLower middle incomeLuxembourgMacao SAR, ChinaMacedonia, FYRMadagascarMalawiMalaysiaMaldivesMaliMaltaMarshall IslandsMauritaniaMauritiusMexicoMicronesia, Fed. Sts.Middle East & North AfricaMiddle East & North Africa (excluding high income)Middle East & North Africa (IDA & IBRD countries)Middle incomeMoldovaMonacoMongoliaMontenegroMoroccoMozambiqueMyanmarNamibiaNauruNepalNetherlandsNew ZealandNicaraguaNigerNigeriaNorth AmericaNorwayOECD membersOmanOther small statesPacific island small statesPakistanPalauPanamaPapua New GuineaParaguayPeruPhilippinesPolandPortugalPost-demographic dividendPre-demographic dividendPuerto RicoQatarRomaniaRussian FederationRwandaSamoaSan MarinoSao Tome and PrincipeSaudi ArabiaSenegalSerbiaSeychellesSierra LeoneSingaporeSint Maarten (Dutch part)Slovak RepublicSloveniaSmall statesSolomon IslandsSomaliaSouth AfricaSouth AsiaSouth Asia (IDA & IBRD)South SudanSpainSri LankaSt. Kitts and NevisSt. LuciaSt. Vincent and the GrenadinesSub-Saharan Africa Sub-Saharan Africa (excluding high income)Sub-Saharan Africa (IDA & IBRD countries)SudanSurinameSwazilandSwedenSwitzerlandSyrian Arab RepublicTajikistanTanzaniaThailandTimor-LesteTogoTongaTrinidad and TobagoTunisiaTurkeyTurkmenistanTurks and Caicos IslandsTuvaluUgandaUkraineUnited Arab EmiratesUnited KingdomUnited StatesUpper middle incomeUruguayUzbekistanVanuatuVenezuela, RBVietnamWest Bank and GazaWorldYemen, Rep.ZambiaZimbabwe Timeline:
This timeline shows a graph from 1972 to 2015 of Hong Kong SAR, China. No data until 1971. Number of actual observations by date: 37.
Source name:
World Development Indicators
Source organization:
United Nations Educational, Scientific, and Cultural Organization (UNESCO) Institute for Statistics.
Categories, topics:
Education, Gender
Last updated:
apr 23, 2017
Indicators value changes by year
Minimum:
47.382
jan 1, 1972
Maximum:
48.699
jan 1, 1996
At the date of observation
Value
Absolute change
Change from previous value
jan 1, 1972
47.382
+47.382
0.0%
jan 1, 1973
47.759
+0.376
0.79%
jan 1, 1974
47.957
+0.198
0.41%
jan 1, 1975
47.993
+0.036
0.08%
jan 1, 1976
47.945
-0.048
-0.1%
jan 1, 1977
47.941
-0.003
-0.01%
jan 1, 1978
47.845
-0.096
-0.2%
jan 1, 1979
47.864
+0.018
0.04%
jan 1, 1980
47.89
+0.026
0.05%
jan 1, 1981
47.841
-0.049
-0.1%
jan 1, 1982
47.882
+0.041
0.09%
jan 1, 1983
47.84
-0.041
-0.09%
jan 1, 1984
47.71
-0.13
-0.27%
jan 1, 1985
47.638
-0.072
-0.15%
jan 1, 1986
47.654
+0.016
0.03%
jan 1, 1987
47.666
+0.012
0.02%
jan 1, 1988
47.621
-0.045
-0.09%
jan 1, 1989
47.875
+0.254
0.53%
jan 1, 1996
48.699
+0.824
1.72%
jan 1, 1997
48.36
-0.339
-0.7%
jan 1, 1999
48.157
-0.204
-0.42%
jan 1, 2000
47.831
-0.326
-0.68%
jan 1, 2001
47.722
-0.108
-0.23%
jan 1, 2002
48.064
+0.342
0.72%
jan 1, 2003
48.055
-0.009
-0.02%
jan 1, 2004
48.094
+0.039
0.08%
jan 1, 2005
48.062
-0.032
-0.07%
jan 1, 2006
48.037
-0.025
-0.05%
jan 1, 2007
47.978
-0.06
-0.12%
jan 1, 2008
47.936
-0.041
-0.09%
jan 1, 2009
47.843
-0.093
-0.19%
jan 1, 2010
47.864
+0.021
0.04%
jan 1, 2011
47.86
-0.003
-0.01%
jan 1, 2012
47.876
+0.016
0.03%
jan 1, 2013
47.916
+0.04
0.08%
jan 1, 2014
47.913
-0.004
-0.01%
jan 1, 2015
47.981
+0.068
0.14%
Ranking of countries by current statistics by years


Comments: