29
/
en
AIzaSyAYiBZKx7MnpbEhh9jyipgxe19OcubqV5w
April 1, 2024
42917
Latin America & Caribbean (excluding high income)
LAC
false
2
1
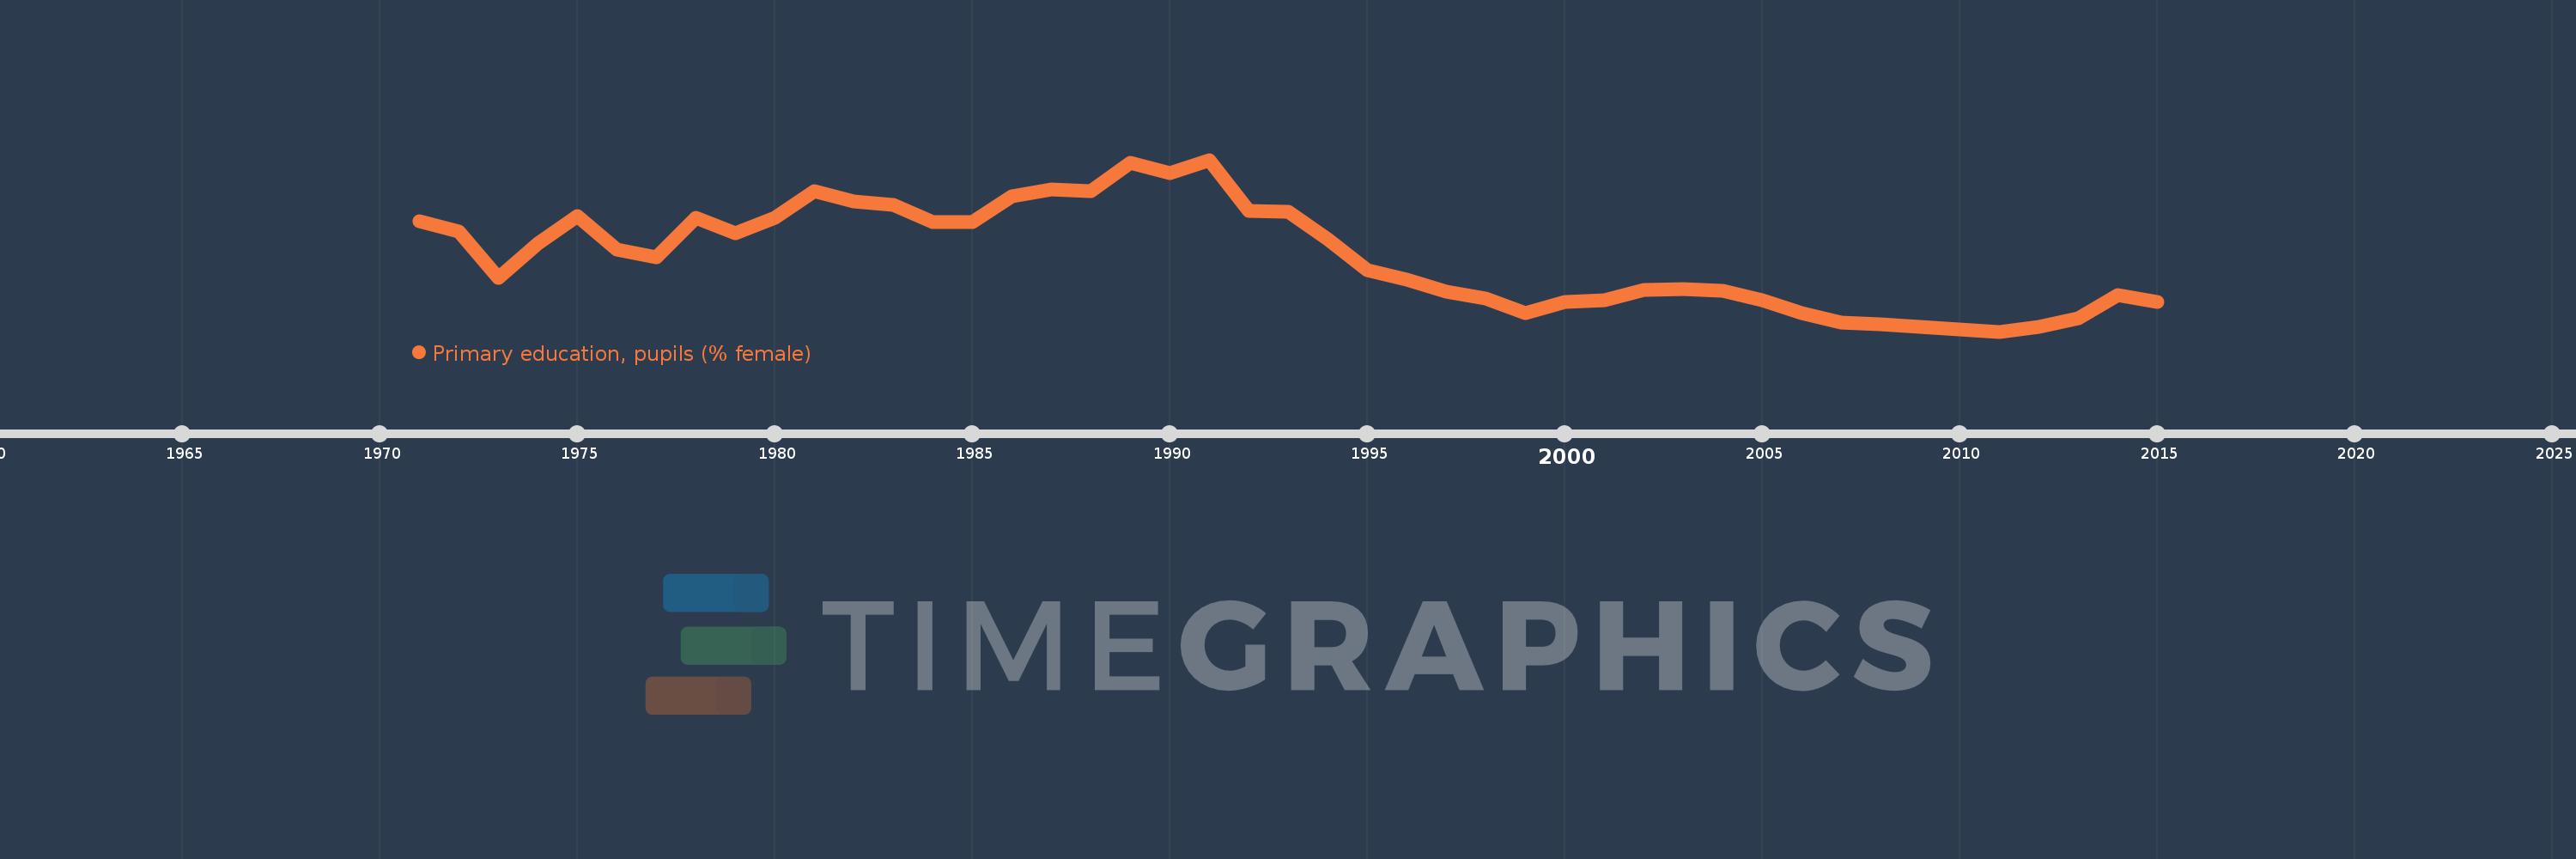
Primary education, pupils (% female)
2015,2014,2013,2012,2011,2010,2009,2008,2007,2006,2005,2004,2003,2002,2001,2000,1999,1998,1997,1996,1995,1994,1993,1992,1991,1990,1989,1988,1987,1986,1985,1984,1983,1982,1981,1980,1979,1978,1977,1976,1975,1974,1973,1972,1971
This statistics in other country:
AfghanistanAlbaniaAlgeriaAndorraAngolaAntigua and BarbudaArab WorldArgentinaArmeniaArubaAustraliaAustriaAzerbaijanBahamas, TheBahrainBangladeshBarbadosBelarusBelgiumBelizeBeninBermudaBhutanBoliviaBosnia and HerzegovinaBotswanaBrazilBritish Virgin IslandsBrunei DarussalamBulgariaBurkina FasoBurundiCabo VerdeCambodiaCameroonCanadaCaribbean small statesCayman IslandsCentral African RepublicCentral Europe and the BalticsChadChileChinaColombiaComorosCongo, Dem. Rep.Congo, Rep.Costa RicaCote d'IvoireCroatiaCubaCuracaoCyprusCzech RepublicDenmarkDjiboutiDominicaDominican RepublicEarly-demographic dividendEast Asia & PacificEast Asia & Pacific (excluding high income)East Asia & Pacific (IDA & IBRD countries)EcuadorEgypt, Arab Rep.El SalvadorEquatorial GuineaEritreaEstoniaEthiopiaEuro areaEurope & Central AsiaEurope & Central Asia (excluding high income)Europe & Central Asia (IDA & IBRD countries)European UnionFijiFinlandFragile and conflict affected situationsFranceGabonGambia, TheGeorgiaGermanyGhanaGibraltarGreeceGrenadaGuatemalaGuineaGuinea-BissauGuyanaHaitiHeavily indebted poor countries (HIPC)High incomeHondurasHong Kong SAR, ChinaHungaryIBRD onlyIcelandIDA & IBRD totalIDA blendIDA onlyIDA totalIndiaIndonesiaIran, Islamic Rep.IraqIrelandIsraelItalyJamaicaJapanJordanKazakhstanKenyaKiribatiKorea, Dem. People’s Rep.Korea, Rep.KuwaitKyrgyz RepublicLao PDRLate-demographic dividendLatin America & Caribbean Latin America & Caribbean (excluding high income)Latin America & the Caribbean (IDA & IBRD countries)LatviaLeast developed countries: UN classificationLebanonLesothoLiberiaLibyaLiechtensteinLithuaniaLow & middle incomeLow incomeLower middle incomeLuxembourgMacao SAR, ChinaMacedonia, FYRMadagascarMalawiMalaysiaMaldivesMaliMaltaMarshall IslandsMauritaniaMauritiusMexicoMicronesia, Fed. Sts.Middle East & North AfricaMiddle East & North Africa (excluding high income)Middle East & North Africa (IDA & IBRD countries)Middle incomeMoldovaMonacoMongoliaMontenegroMoroccoMozambiqueMyanmarNamibiaNauruNepalNetherlandsNew ZealandNicaraguaNigerNigeriaNorth AmericaNorwayOECD membersOmanOther small statesPacific island small statesPakistanPalauPanamaPapua New GuineaParaguayPeruPhilippinesPolandPortugalPost-demographic dividendPre-demographic dividendPuerto RicoQatarRomaniaRussian FederationRwandaSamoaSan MarinoSao Tome and PrincipeSaudi ArabiaSenegalSerbiaSeychellesSierra LeoneSingaporeSint Maarten (Dutch part)Slovak RepublicSloveniaSmall statesSolomon IslandsSomaliaSouth AfricaSouth AsiaSouth Asia (IDA & IBRD)South SudanSpainSri LankaSt. Kitts and NevisSt. LuciaSt. Vincent and the GrenadinesSub-Saharan Africa Sub-Saharan Africa (excluding high income)Sub-Saharan Africa (IDA & IBRD countries)SudanSurinameSwazilandSwedenSwitzerlandSyrian Arab RepublicTajikistanTanzaniaThailandTimor-LesteTogoTongaTrinidad and TobagoTunisiaTurkeyTurkmenistanTurks and Caicos IslandsTuvaluUgandaUkraineUnited Arab EmiratesUnited KingdomUnited StatesUpper middle incomeUruguayUzbekistanVanuatuVenezuela, RBVietnamWest Bank and GazaWorldYemen, Rep.ZambiaZimbabwe Timeline:
This timeline shows a graph from 1971 to 2015 of Latin America & Caribbean (excluding high income). No data until 1970. Number of actual observations by date: 45.
Source name:
World Development Indicators
Source organization:
United Nations Educational, Scientific, and Cultural Organization (UNESCO) Institute for Statistics.
Categories, topics:
Education, Gender
Last updated:
apr 23, 2017
Indicators value changes by year
Minimum:
48.264
jan 1, 2011
Maximum:
49.008
jan 1, 1991
At the date of observation
Value
Absolute change
Change from previous value
jan 1, 1971
48.741
+48.741
0.0%
jan 1, 1972
48.698
-0.043
-0.09%
jan 1, 1973
48.495
-0.203
-0.42%
jan 1, 1974
48.646
+0.151
0.31%
jan 1, 1975
48.764
+0.119
0.24%
jan 1, 1976
48.621
-0.144
-0.29%
jan 1, 1977
48.586
-0.034
-0.07%
jan 1, 1978
48.757
+0.17
0.35%
jan 1, 1979
48.69
-0.066
-0.14%
jan 1, 1980
48.758
+0.067
0.14%
jan 1, 1981
48.874
+0.116
0.24%
jan 1, 1982
48.828
-0.045
-0.09%
jan 1, 1983
48.814
-0.015
-0.03%
jan 1, 1984
48.74
-0.074
-0.15%
jan 1, 1985
48.74
+0.0
0.0%
jan 1, 1986
48.849
+0.109
0.22%
jan 1, 1987
48.878
+0.029
0.06%
jan 1, 1988
48.871
-0.007
-0.01%
jan 1, 1989
48.994
+0.123
0.25%
jan 1, 1990
48.952
-0.042
-0.08%
jan 1, 1991
49.008
+0.056
0.11%
jan 1, 1992
48.787
-0.221
-0.45%
jan 1, 1993
48.783
-0.004
-0.01%
jan 1, 1994
48.664
-0.119
-0.24%
jan 1, 1995
48.531
-0.133
-0.27%
jan 1, 1996
48.49
-0.041
-0.08%
jan 1, 1997
48.437
-0.054
-0.11%
jan 1, 1998
48.409
-0.027
-0.06%
jan 1, 1999
48.344
-0.065
-0.14%
jan 1, 2000
48.394
+0.05
0.1%
jan 1, 2001
48.399
+0.005
0.01%
jan 1, 2002
48.445
+0.046
0.09%
jan 1, 2003
48.447
+0.002
0.0%
jan 1, 2004
48.439
-0.008
-0.02%
jan 1, 2005
48.4
-0.039
-0.08%
jan 1, 2006
48.344
-0.056
-0.12%
jan 1, 2007
48.304
-0.041
-0.08%
jan 1, 2008
48.294
-0.01
-0.02%
jan 1, 2009
48.285
-0.008
-0.02%
jan 1, 2010
48.274
-0.011
-0.02%
jan 1, 2011
48.264
-0.01
-0.02%
jan 1, 2012
48.286
+0.022
0.05%
jan 1, 2013
48.323
+0.037
0.08%
jan 1, 2014
48.421
+0.098
0.2%
jan 1, 2015
48.393
-0.028
-0.06%
Ranking of countries by current statistics by years


Comments: