29
/
en
AIzaSyAYiBZKx7MnpbEhh9jyipgxe19OcubqV5w
April 1, 2024
48493
Middle East & North Africa
MEA
false
2
1
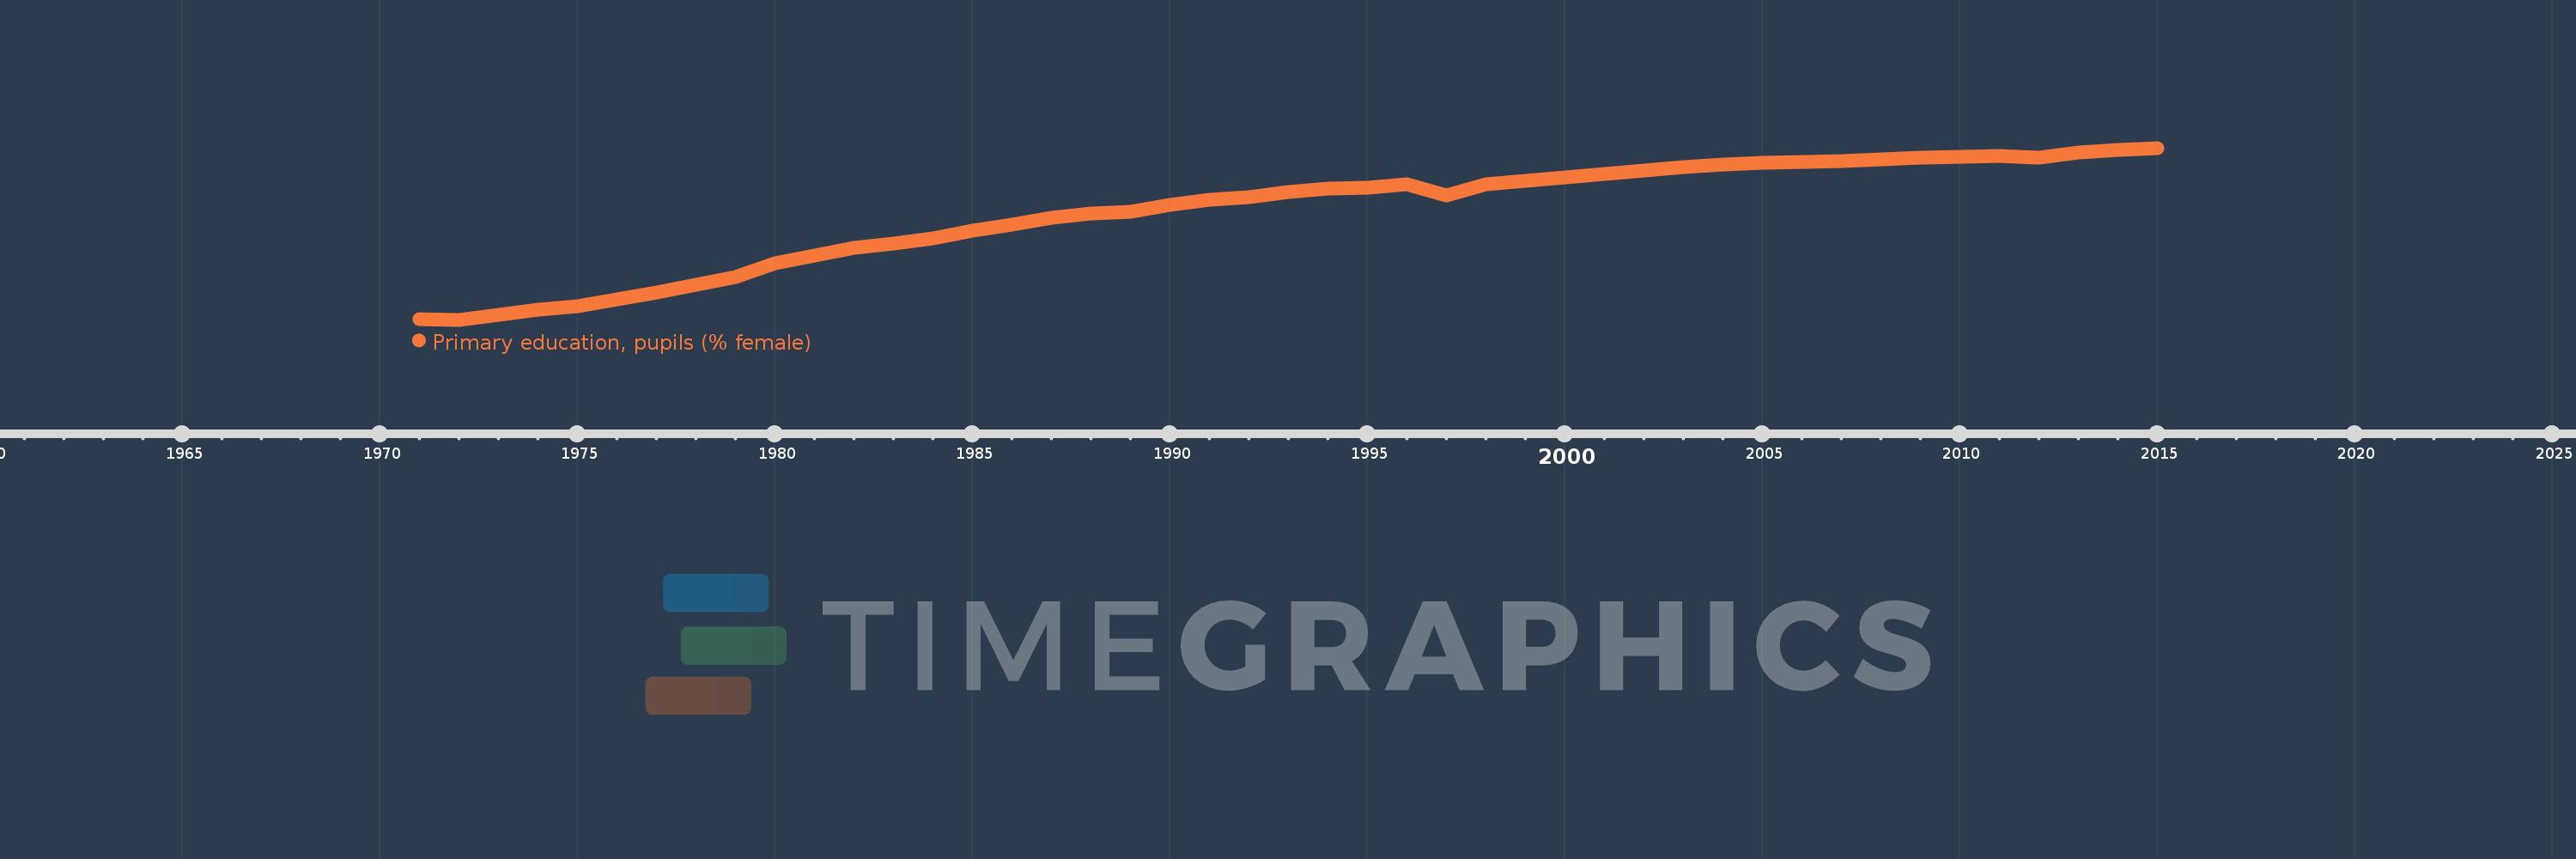
Primary education, pupils (% female)
2015,2014,2013,2012,2011,2010,2009,2008,2007,2006,2005,2004,2003,2002,2001,2000,1999,1998,1997,1996,1995,1994,1993,1992,1991,1990,1989,1988,1987,1986,1985,1984,1983,1982,1981,1980,1979,1978,1977,1976,1975,1974,1973,1972,1971
This statistics in other country:
AfghanistanAlbaniaAlgeriaAndorraAngolaAntigua and BarbudaArab WorldArgentinaArmeniaArubaAustraliaAustriaAzerbaijanBahamas, TheBahrainBangladeshBarbadosBelarusBelgiumBelizeBeninBermudaBhutanBoliviaBosnia and HerzegovinaBotswanaBrazilBritish Virgin IslandsBrunei DarussalamBulgariaBurkina FasoBurundiCabo VerdeCambodiaCameroonCanadaCaribbean small statesCayman IslandsCentral African RepublicCentral Europe and the BalticsChadChileChinaColombiaComorosCongo, Dem. Rep.Congo, Rep.Costa RicaCote d'IvoireCroatiaCubaCuracaoCyprusCzech RepublicDenmarkDjiboutiDominicaDominican RepublicEarly-demographic dividendEast Asia & PacificEast Asia & Pacific (excluding high income)East Asia & Pacific (IDA & IBRD countries)EcuadorEgypt, Arab Rep.El SalvadorEquatorial GuineaEritreaEstoniaEthiopiaEuro areaEurope & Central AsiaEurope & Central Asia (excluding high income)Europe & Central Asia (IDA & IBRD countries)European UnionFijiFinlandFragile and conflict affected situationsFranceGabonGambia, TheGeorgiaGermanyGhanaGibraltarGreeceGrenadaGuatemalaGuineaGuinea-BissauGuyanaHaitiHeavily indebted poor countries (HIPC)High incomeHondurasHong Kong SAR, ChinaHungaryIBRD onlyIcelandIDA & IBRD totalIDA blendIDA onlyIDA totalIndiaIndonesiaIran, Islamic Rep.IraqIrelandIsraelItalyJamaicaJapanJordanKazakhstanKenyaKiribatiKorea, Dem. People’s Rep.Korea, Rep.KuwaitKyrgyz RepublicLao PDRLate-demographic dividendLatin America & Caribbean Latin America & Caribbean (excluding high income)Latin America & the Caribbean (IDA & IBRD countries)LatviaLeast developed countries: UN classificationLebanonLesothoLiberiaLibyaLiechtensteinLithuaniaLow & middle incomeLow incomeLower middle incomeLuxembourgMacao SAR, ChinaMacedonia, FYRMadagascarMalawiMalaysiaMaldivesMaliMaltaMarshall IslandsMauritaniaMauritiusMexicoMicronesia, Fed. Sts.Middle East & North AfricaMiddle East & North Africa (excluding high income)Middle East & North Africa (IDA & IBRD countries)Middle incomeMoldovaMonacoMongoliaMontenegroMoroccoMozambiqueMyanmarNamibiaNauruNepalNetherlandsNew ZealandNicaraguaNigerNigeriaNorth AmericaNorwayOECD membersOmanOther small statesPacific island small statesPakistanPalauPanamaPapua New GuineaParaguayPeruPhilippinesPolandPortugalPost-demographic dividendPre-demographic dividendPuerto RicoQatarRomaniaRussian FederationRwandaSamoaSan MarinoSao Tome and PrincipeSaudi ArabiaSenegalSerbiaSeychellesSierra LeoneSingaporeSint Maarten (Dutch part)Slovak RepublicSloveniaSmall statesSolomon IslandsSomaliaSouth AfricaSouth AsiaSouth Asia (IDA & IBRD)South SudanSpainSri LankaSt. Kitts and NevisSt. LuciaSt. Vincent and the GrenadinesSub-Saharan Africa Sub-Saharan Africa (excluding high income)Sub-Saharan Africa (IDA & IBRD countries)SudanSurinameSwazilandSwedenSwitzerlandSyrian Arab RepublicTajikistanTanzaniaThailandTimor-LesteTogoTongaTrinidad and TobagoTunisiaTurkeyTurkmenistanTurks and Caicos IslandsTuvaluUgandaUkraineUnited Arab EmiratesUnited KingdomUnited StatesUpper middle incomeUruguayUzbekistanVanuatuVenezuela, RBVietnamWest Bank and GazaWorldYemen, Rep.ZambiaZimbabwe Timeline:
This timeline shows a graph from 1971 to 2015 of Middle East & North Africa. No data until 1970. Number of actual observations by date: 45.
Source name:
World Development Indicators
Source organization:
United Nations Educational, Scientific, and Cultural Organization (UNESCO) Institute for Statistics.
Categories, topics:
Education, Gender
Last updated:
apr 23, 2017
Indicators value changes by year
Minimum:
36.902
jan 1, 1972
Maximum:
47.767
jan 1, 2015
At the date of observation
Value
Absolute change
Change from previous value
jan 1, 1971
36.941
+36.941
0.0%
jan 1, 1972
36.902
-0.039
-0.11%
jan 1, 1973
37.205
+0.303
0.82%
jan 1, 1974
37.527
+0.322
0.87%
jan 1, 1975
37.742
+0.216
0.57%
jan 1, 1976
38.185
+0.443
1.17%
jan 1, 1977
38.635
+0.45
1.18%
jan 1, 1978
39.139
+0.503
1.3%
jan 1, 1979
39.592
+0.453
1.16%
jan 1, 1980
40.494
+0.902
2.28%
jan 1, 1981
40.967
+0.473
1.17%
jan 1, 1982
41.422
+0.455
1.11%
jan 1, 1983
41.735
+0.313
0.76%
jan 1, 1984
42.064
+0.329
0.79%
jan 1, 1985
42.511
+0.446
1.06%
jan 1, 1986
42.927
+0.416
0.98%
jan 1, 1987
43.335
+0.408
0.95%
jan 1, 1988
43.626
+0.291
0.67%
jan 1, 1989
43.738
+0.113
0.26%
jan 1, 1990
44.175
+0.437
1.0%
jan 1, 1991
44.503
+0.328
0.74%
jan 1, 1992
44.639
+0.136
0.31%
jan 1, 1993
44.985
+0.346
0.77%
jan 1, 1994
45.173
+0.187
0.42%
jan 1, 1995
45.226
+0.053
0.12%
jan 1, 1996
45.459
+0.233
0.52%
jan 1, 1997
44.759
-0.7
-1.54%
jan 1, 1998
45.495
+0.736
1.65%
jan 1, 1999
45.673
+0.177
0.39%
jan 1, 2000
45.893
+0.22
0.48%
jan 1, 2001
46.11
+0.217
0.47%
jan 1, 2002
46.35
+0.241
0.52%
jan 1, 2003
46.552
+0.202
0.44%
jan 1, 2004
46.706
+0.154
0.33%
jan 1, 2005
46.818
+0.112
0.24%
jan 1, 2006
46.859
+0.041
0.09%
jan 1, 2007
46.918
+0.059
0.13%
jan 1, 2008
47.045
+0.126
0.27%
jan 1, 2009
47.141
+0.097
0.21%
jan 1, 2010
47.193
+0.051
0.11%
jan 1, 2011
47.275
+0.082
0.17%
jan 1, 2012
47.179
-0.096
-0.2%
jan 1, 2013
47.454
+0.276
0.58%
jan 1, 2014
47.642
+0.188
0.4%
jan 1, 2015
47.767
+0.125
0.26%
Ranking of countries by current statistics by years


Comments: