29
/
en
AIzaSyAYiBZKx7MnpbEhh9jyipgxe19OcubqV5w
April 1, 2024
220150
Papua New Guinea
PNG
true
2
1
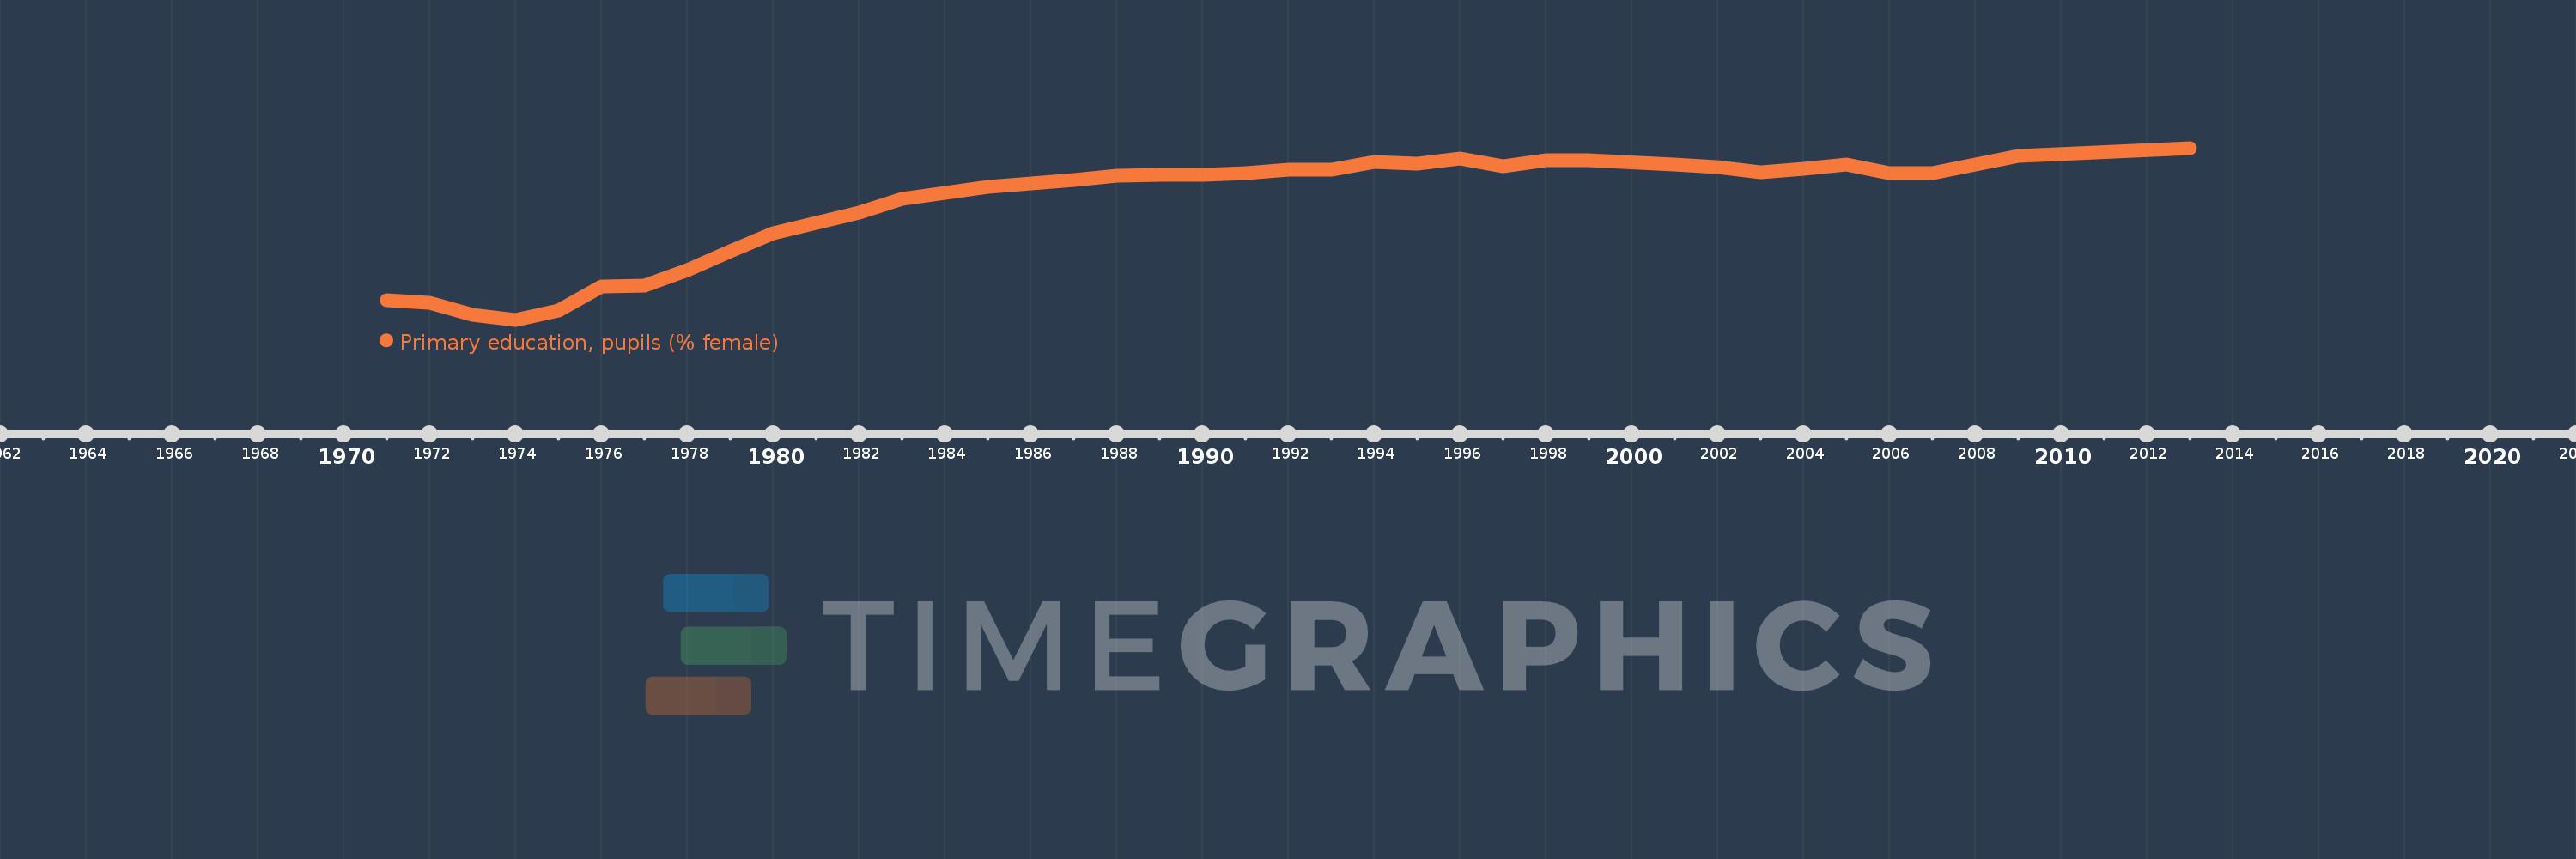
Primary education, pupils (% female)
2013,2009,2007,2006,2005,2004,2003,2002,2001,1999,1998,1997,1996,1995,1994,1993,1992,1991,1990,1989,1988,1987,1985,1983,1982,1980,1979,1978,1977,1976,1975,1974,1973,1972,1971
This statistics in other country:
AfghanistanAlbaniaAlgeriaAndorraAngolaAntigua and BarbudaArab WorldArgentinaArmeniaArubaAustraliaAustriaAzerbaijanBahamas, TheBahrainBangladeshBarbadosBelarusBelgiumBelizeBeninBermudaBhutanBoliviaBosnia and HerzegovinaBotswanaBrazilBritish Virgin IslandsBrunei DarussalamBulgariaBurkina FasoBurundiCabo VerdeCambodiaCameroonCanadaCaribbean small statesCayman IslandsCentral African RepublicCentral Europe and the BalticsChadChileChinaColombiaComorosCongo, Dem. Rep.Congo, Rep.Costa RicaCote d'IvoireCroatiaCubaCuracaoCyprusCzech RepublicDenmarkDjiboutiDominicaDominican RepublicEarly-demographic dividendEast Asia & PacificEast Asia & Pacific (excluding high income)East Asia & Pacific (IDA & IBRD countries)EcuadorEgypt, Arab Rep.El SalvadorEquatorial GuineaEritreaEstoniaEthiopiaEuro areaEurope & Central AsiaEurope & Central Asia (excluding high income)Europe & Central Asia (IDA & IBRD countries)European UnionFijiFinlandFragile and conflict affected situationsFranceGabonGambia, TheGeorgiaGermanyGhanaGibraltarGreeceGrenadaGuatemalaGuineaGuinea-BissauGuyanaHaitiHeavily indebted poor countries (HIPC)High incomeHondurasHong Kong SAR, ChinaHungaryIBRD onlyIcelandIDA & IBRD totalIDA blendIDA onlyIDA totalIndiaIndonesiaIran, Islamic Rep.IraqIrelandIsraelItalyJamaicaJapanJordanKazakhstanKenyaKiribatiKorea, Dem. People’s Rep.Korea, Rep.KuwaitKyrgyz RepublicLao PDRLate-demographic dividendLatin America & Caribbean Latin America & Caribbean (excluding high income)Latin America & the Caribbean (IDA & IBRD countries)LatviaLeast developed countries: UN classificationLebanonLesothoLiberiaLibyaLiechtensteinLithuaniaLow & middle incomeLow incomeLower middle incomeLuxembourgMacao SAR, ChinaMacedonia, FYRMadagascarMalawiMalaysiaMaldivesMaliMaltaMarshall IslandsMauritaniaMauritiusMexicoMicronesia, Fed. Sts.Middle East & North AfricaMiddle East & North Africa (excluding high income)Middle East & North Africa (IDA & IBRD countries)Middle incomeMoldovaMonacoMongoliaMontenegroMoroccoMozambiqueMyanmarNamibiaNauruNepalNetherlandsNew ZealandNicaraguaNigerNigeriaNorth AmericaNorwayOECD membersOmanOther small statesPacific island small statesPakistanPalauPanamaPapua New GuineaParaguayPeruPhilippinesPolandPortugalPost-demographic dividendPre-demographic dividendPuerto RicoQatarRomaniaRussian FederationRwandaSamoaSan MarinoSao Tome and PrincipeSaudi ArabiaSenegalSerbiaSeychellesSierra LeoneSingaporeSint Maarten (Dutch part)Slovak RepublicSloveniaSmall statesSolomon IslandsSomaliaSouth AfricaSouth AsiaSouth Asia (IDA & IBRD)South SudanSpainSri LankaSt. Kitts and NevisSt. LuciaSt. Vincent and the GrenadinesSub-Saharan Africa Sub-Saharan Africa (excluding high income)Sub-Saharan Africa (IDA & IBRD countries)SudanSurinameSwazilandSwedenSwitzerlandSyrian Arab RepublicTajikistanTanzaniaThailandTimor-LesteTogoTongaTrinidad and TobagoTunisiaTurkeyTurkmenistanTurks and Caicos IslandsTuvaluUgandaUkraineUnited Arab EmiratesUnited KingdomUnited StatesUpper middle incomeUruguayUzbekistanVanuatuVenezuela, RBVietnamWest Bank and GazaWorldYemen, Rep.ZambiaZimbabwe Timeline:
This timeline shows a graph from 1971 to 2013 of Papua New Guinea. No data until 1970. Number of actual observations by date: 35.
Source name:
World Development Indicators
Source organization:
United Nations Educational, Scientific, and Cultural Organization (UNESCO) Institute for Statistics.
Categories, topics:
Education, Gender
Last updated:
apr 23, 2017
Indicators value changes by year
Minimum:
35.284
jan 1, 1974
Maximum:
45.907
jan 1, 2013
At the date of observation
Value
Absolute change
Change from previous value
jan 1, 1971
36.497
+36.497
0.0%
jan 1, 1972
36.321
-0.176
-0.48%
jan 1, 1973
35.574
-0.746
-2.05%
jan 1, 1974
35.284
-0.291
-0.82%
jan 1, 1975
35.861
+0.577
1.64%
jan 1, 1976
37.351
+1.49
4.15%
jan 1, 1977
37.391
+0.04
0.11%
jan 1, 1978
38.36
+0.97
2.59%
jan 1, 1979
39.525
+1.165
3.04%
jan 1, 1980
40.642
+1.117
2.83%
jan 1, 1982
41.922
+1.28
3.15%
jan 1, 1983
42.759
+0.837
2.0%
jan 1, 1985
43.481
+0.722
1.69%
jan 1, 1987
43.932
+0.451
1.04%
jan 1, 1988
44.204
+0.272
0.62%
jan 1, 1989
44.267
+0.064
0.14%
jan 1, 1990
44.235
-0.032
-0.07%
jan 1, 1991
44.347
+0.113
0.25%
jan 1, 1992
44.571
+0.223
0.5%
jan 1, 1993
44.577
+0.006
0.01%
jan 1, 1994
45.017
+0.44
0.99%
jan 1, 1995
44.93
-0.086
-0.19%
jan 1, 1996
45.275
+0.345
0.77%
jan 1, 1997
44.781
-0.494
-1.09%
jan 1, 1998
45.137
+0.356
0.8%
jan 1, 1999
45.159
+0.022
0.05%
jan 1, 2001
44.882
-0.277
-0.61%
jan 1, 2002
44.734
-0.149
-0.33%
jan 1, 2003
44.397
-0.337
-0.75%
jan 1, 2004
44.641
+0.244
0.55%
jan 1, 2005
44.866
+0.226
0.51%
jan 1, 2006
44.358
-0.508
-1.13%
jan 1, 2007
44.336
-0.022
-0.05%
jan 1, 2009
45.432
+1.095
2.47%
jan 1, 2013
45.907
+0.476
1.05%
Ranking of countries by current statistics by years


Comments: