29
/
en
AIzaSyAYiBZKx7MnpbEhh9jyipgxe19OcubqV5w
April 1, 2024
165453
Jordan
JOR
true
2
1
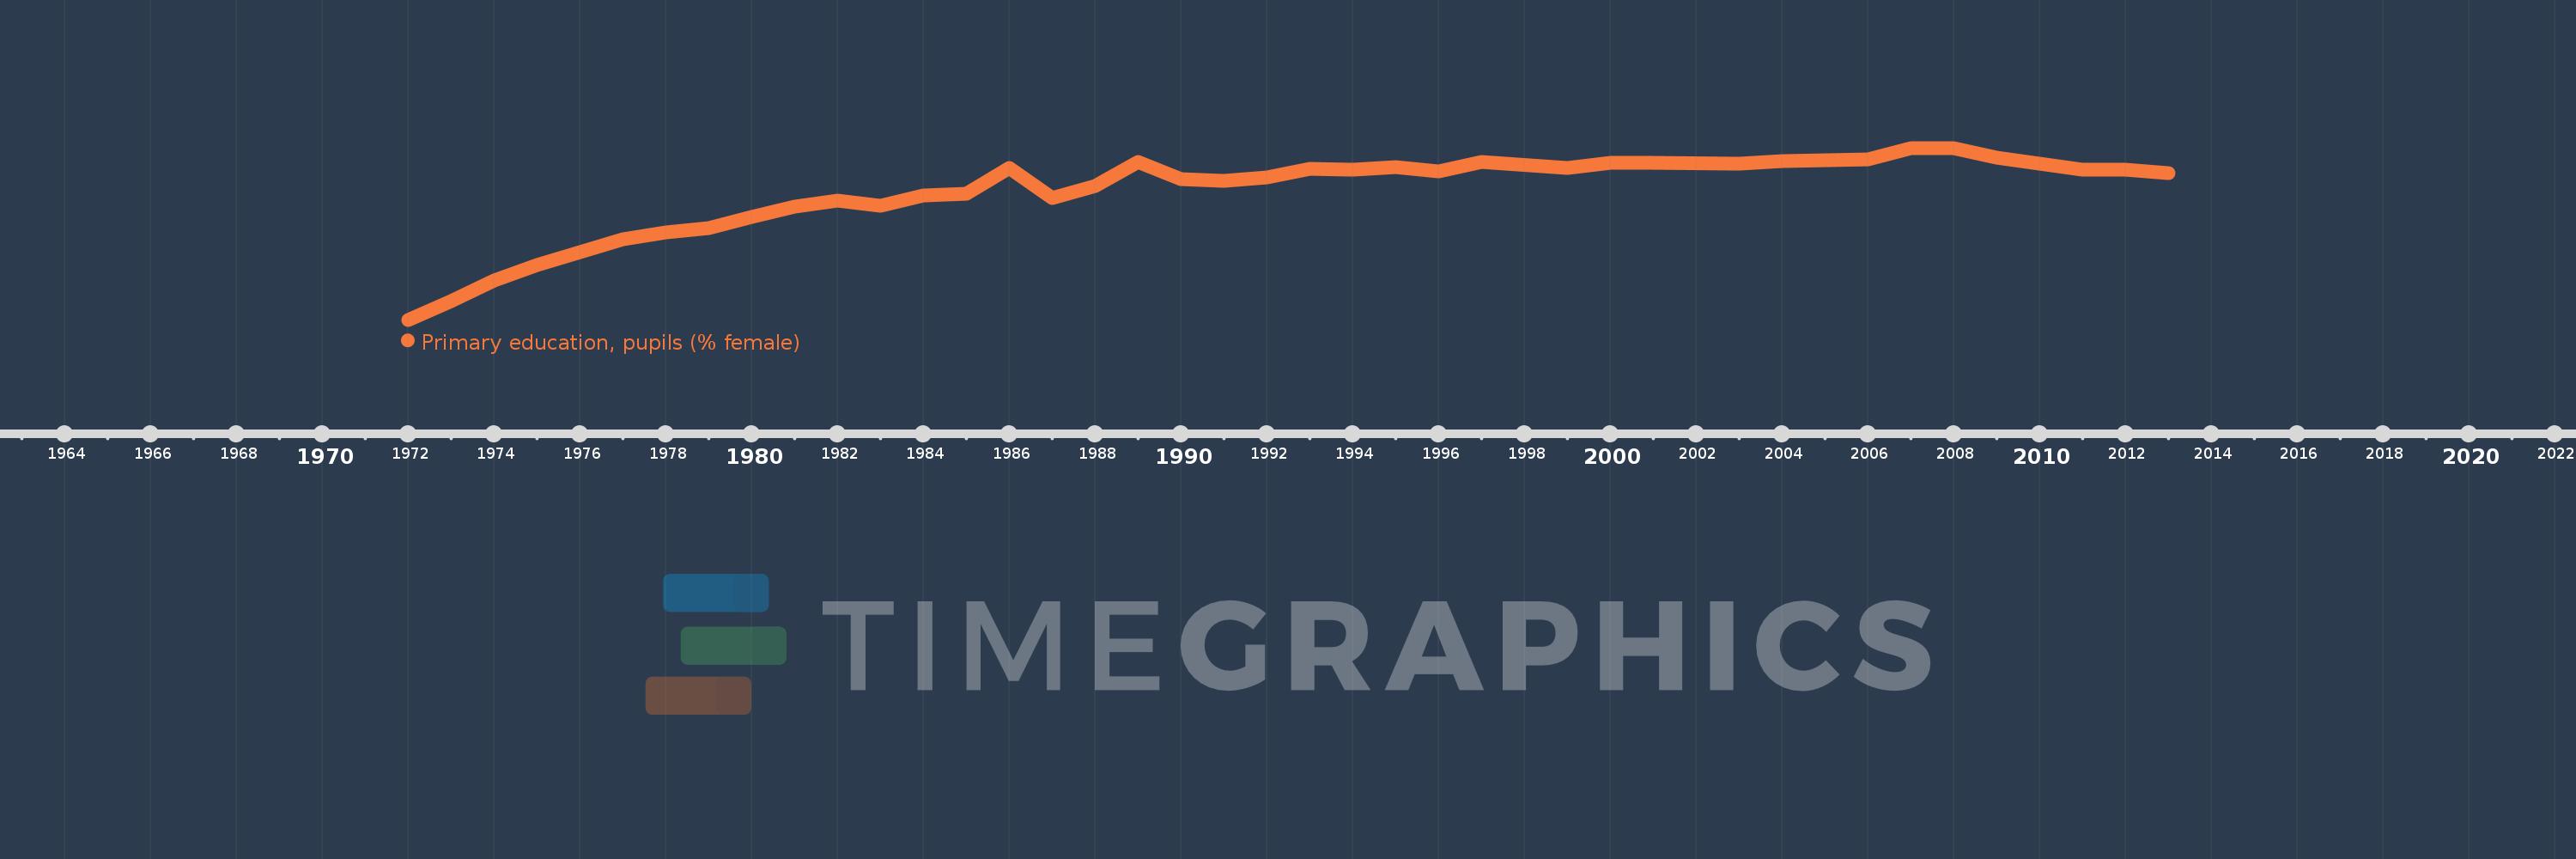
Primary education, pupils (% female)
2013,2012,2011,2009,2008,2007,2006,2005,2004,2003,2001,2000,1999,1997,1996,1995,1994,1993,1992,1991,1990,1989,1988,1987,1986,1985,1984,1983,1982,1981,1980,1979,1978,1977,1976,1975,1974,1973,1972
This statistics in other country:
AfghanistanAlbaniaAlgeriaAndorraAngolaAntigua and BarbudaArab WorldArgentinaArmeniaArubaAustraliaAustriaAzerbaijanBahamas, TheBahrainBangladeshBarbadosBelarusBelgiumBelizeBeninBermudaBhutanBoliviaBosnia and HerzegovinaBotswanaBrazilBritish Virgin IslandsBrunei DarussalamBulgariaBurkina FasoBurundiCabo VerdeCambodiaCameroonCanadaCaribbean small statesCayman IslandsCentral African RepublicCentral Europe and the BalticsChadChileChinaColombiaComorosCongo, Dem. Rep.Congo, Rep.Costa RicaCote d'IvoireCroatiaCubaCuracaoCyprusCzech RepublicDenmarkDjiboutiDominicaDominican RepublicEarly-demographic dividendEast Asia & PacificEast Asia & Pacific (excluding high income)East Asia & Pacific (IDA & IBRD countries)EcuadorEgypt, Arab Rep.El SalvadorEquatorial GuineaEritreaEstoniaEthiopiaEuro areaEurope & Central AsiaEurope & Central Asia (excluding high income)Europe & Central Asia (IDA & IBRD countries)European UnionFijiFinlandFragile and conflict affected situationsFranceGabonGambia, TheGeorgiaGermanyGhanaGibraltarGreeceGrenadaGuatemalaGuineaGuinea-BissauGuyanaHaitiHeavily indebted poor countries (HIPC)High incomeHondurasHong Kong SAR, ChinaHungaryIBRD onlyIcelandIDA & IBRD totalIDA blendIDA onlyIDA totalIndiaIndonesiaIran, Islamic Rep.IraqIrelandIsraelItalyJamaicaJapanJordanKazakhstanKenyaKiribatiKorea, Dem. People’s Rep.Korea, Rep.KuwaitKyrgyz RepublicLao PDRLate-demographic dividendLatin America & Caribbean Latin America & Caribbean (excluding high income)Latin America & the Caribbean (IDA & IBRD countries)LatviaLeast developed countries: UN classificationLebanonLesothoLiberiaLibyaLiechtensteinLithuaniaLow & middle incomeLow incomeLower middle incomeLuxembourgMacao SAR, ChinaMacedonia, FYRMadagascarMalawiMalaysiaMaldivesMaliMaltaMarshall IslandsMauritaniaMauritiusMexicoMicronesia, Fed. Sts.Middle East & North AfricaMiddle East & North Africa (excluding high income)Middle East & North Africa (IDA & IBRD countries)Middle incomeMoldovaMonacoMongoliaMontenegroMoroccoMozambiqueMyanmarNamibiaNauruNepalNetherlandsNew ZealandNicaraguaNigerNigeriaNorth AmericaNorwayOECD membersOmanOther small statesPacific island small statesPakistanPalauPanamaPapua New GuineaParaguayPeruPhilippinesPolandPortugalPost-demographic dividendPre-demographic dividendPuerto RicoQatarRomaniaRussian FederationRwandaSamoaSan MarinoSao Tome and PrincipeSaudi ArabiaSenegalSerbiaSeychellesSierra LeoneSingaporeSint Maarten (Dutch part)Slovak RepublicSloveniaSmall statesSolomon IslandsSomaliaSouth AfricaSouth AsiaSouth Asia (IDA & IBRD)South SudanSpainSri LankaSt. Kitts and NevisSt. LuciaSt. Vincent and the GrenadinesSub-Saharan Africa Sub-Saharan Africa (excluding high income)Sub-Saharan Africa (IDA & IBRD countries)SudanSurinameSwazilandSwedenSwitzerlandSyrian Arab RepublicTajikistanTanzaniaThailandTimor-LesteTogoTongaTrinidad and TobagoTunisiaTurkeyTurkmenistanTurks and Caicos IslandsTuvaluUgandaUkraineUnited Arab EmiratesUnited KingdomUnited StatesUpper middle incomeUruguayUzbekistanVanuatuVenezuela, RBVietnamWest Bank and GazaWorldYemen, Rep.ZambiaZimbabwe Timeline:
This timeline shows a graph from 1972 to 2013 of Jordan. No data until 1971. Number of actual observations by date: 39.
Source name:
World Development Indicators
Source organization:
United Nations Educational, Scientific, and Cultural Organization (UNESCO) Institute for Statistics.
Categories, topics:
Education, Gender
Last updated:
apr 23, 2017
Indicators value changes by year
Minimum:
43.976
jan 1, 1972
Maximum:
49.303
jan 1, 2007
At the date of observation
Value
Absolute change
Change from previous value
jan 1, 1972
43.976
+43.976
0.0%
jan 1, 1973
44.548
+0.571
1.3%
jan 1, 1974
45.204
+0.656
1.47%
jan 1, 1975
45.663
+0.459
1.02%
jan 1, 1976
46.062
+0.398
0.87%
jan 1, 1977
46.474
+0.412
0.89%
jan 1, 1978
46.678
+0.204
0.44%
jan 1, 1979
46.822
+0.145
0.31%
jan 1, 1980
47.163
+0.341
0.73%
jan 1, 1981
47.495
+0.332
0.7%
jan 1, 1982
47.663
+0.169
0.36%
jan 1, 1983
47.515
-0.149
-0.31%
jan 1, 1984
47.843
+0.328
0.69%
jan 1, 1985
47.893
+0.05
0.1%
jan 1, 1986
48.671
+0.778
1.63%
jan 1, 1987
47.737
-0.934
-1.92%
jan 1, 1988
48.12
+0.383
0.8%
jan 1, 1989
48.882
+0.763
1.59%
jan 1, 1990
48.336
-0.546
-1.12%
jan 1, 1991
48.284
-0.053
-0.11%
jan 1, 1992
48.377
+0.093
0.19%
jan 1, 1993
48.643
+0.266
0.55%
jan 1, 1994
48.634
-0.008
-0.02%
jan 1, 1995
48.718
+0.083
0.17%
jan 1, 1996
48.589
-0.129
-0.26%
jan 1, 1997
48.88
+0.291
0.6%
jan 1, 1999
48.695
-0.184
-0.38%
jan 1, 2000
48.838
+0.142
0.29%
jan 1, 2001
48.842
+0.004
0.01%
jan 1, 2003
48.808
-0.034
-0.07%
jan 1, 2004
48.903
+0.095
0.19%
jan 1, 2005
48.921
+0.019
0.04%
jan 1, 2006
48.948
+0.027
0.06%
jan 1, 2007
49.303
+0.355
0.73%
jan 1, 2008
49.294
-0.009
-0.02%
jan 1, 2009
48.996
-0.298
-0.61%
jan 1, 2011
48.636
-0.36
-0.73%
jan 1, 2012
48.641
+0.004
0.01%
jan 1, 2013
48.523
-0.117
-0.24%
Ranking of countries by current statistics by years


Comments: