29
/
en
AIzaSyAYiBZKx7MnpbEhh9jyipgxe19OcubqV5w
April 1, 2024
27647
East Asia & Pacific
EAS
false
2
1
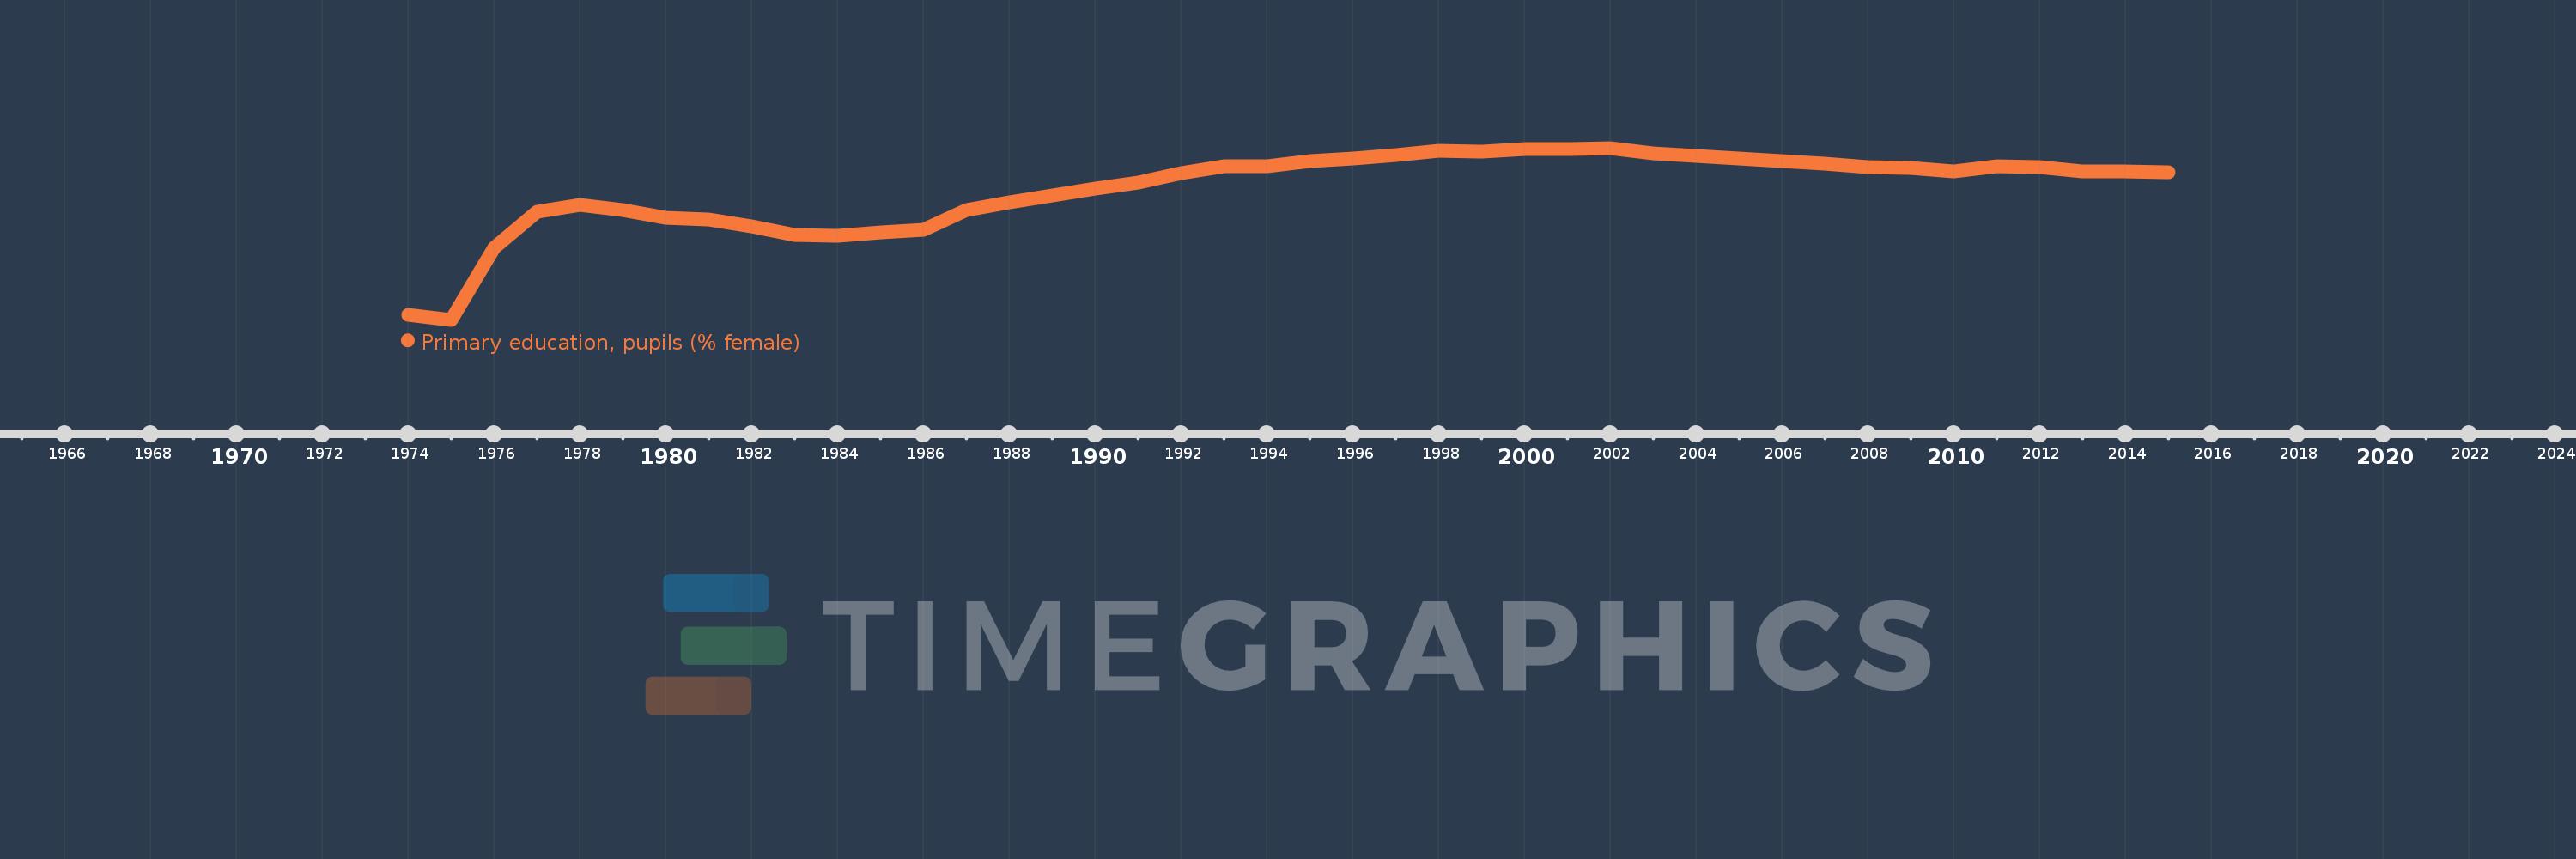
Primary education, pupils (% female)
2015,2014,2013,2012,2011,2010,2009,2008,2007,2006,2005,2004,2003,2002,2001,2000,1999,1998,1997,1996,1995,1994,1993,1992,1991,1990,1989,1988,1987,1986,1985,1984,1983,1982,1981,1980,1979,1978,1977,1976,1975,1974
This statistics in other country:
AfghanistanAlbaniaAlgeriaAndorraAngolaAntigua and BarbudaArab WorldArgentinaArmeniaArubaAustraliaAustriaAzerbaijanBahamas, TheBahrainBangladeshBarbadosBelarusBelgiumBelizeBeninBermudaBhutanBoliviaBosnia and HerzegovinaBotswanaBrazilBritish Virgin IslandsBrunei DarussalamBulgariaBurkina FasoBurundiCabo VerdeCambodiaCameroonCanadaCaribbean small statesCayman IslandsCentral African RepublicCentral Europe and the BalticsChadChileChinaColombiaComorosCongo, Dem. Rep.Congo, Rep.Costa RicaCote d'IvoireCroatiaCubaCuracaoCyprusCzech RepublicDenmarkDjiboutiDominicaDominican RepublicEarly-demographic dividendEast Asia & PacificEast Asia & Pacific (excluding high income)East Asia & Pacific (IDA & IBRD countries)EcuadorEgypt, Arab Rep.El SalvadorEquatorial GuineaEritreaEstoniaEthiopiaEuro areaEurope & Central AsiaEurope & Central Asia (excluding high income)Europe & Central Asia (IDA & IBRD countries)European UnionFijiFinlandFragile and conflict affected situationsFranceGabonGambia, TheGeorgiaGermanyGhanaGibraltarGreeceGrenadaGuatemalaGuineaGuinea-BissauGuyanaHaitiHeavily indebted poor countries (HIPC)High incomeHondurasHong Kong SAR, ChinaHungaryIBRD onlyIcelandIDA & IBRD totalIDA blendIDA onlyIDA totalIndiaIndonesiaIran, Islamic Rep.IraqIrelandIsraelItalyJamaicaJapanJordanKazakhstanKenyaKiribatiKorea, Dem. People’s Rep.Korea, Rep.KuwaitKyrgyz RepublicLao PDRLate-demographic dividendLatin America & Caribbean Latin America & Caribbean (excluding high income)Latin America & the Caribbean (IDA & IBRD countries)LatviaLeast developed countries: UN classificationLebanonLesothoLiberiaLibyaLiechtensteinLithuaniaLow & middle incomeLow incomeLower middle incomeLuxembourgMacao SAR, ChinaMacedonia, FYRMadagascarMalawiMalaysiaMaldivesMaliMaltaMarshall IslandsMauritaniaMauritiusMexicoMicronesia, Fed. Sts.Middle East & North AfricaMiddle East & North Africa (excluding high income)Middle East & North Africa (IDA & IBRD countries)Middle incomeMoldovaMonacoMongoliaMontenegroMoroccoMozambiqueMyanmarNamibiaNauruNepalNetherlandsNew ZealandNicaraguaNigerNigeriaNorth AmericaNorwayOECD membersOmanOther small statesPacific island small statesPakistanPalauPanamaPapua New GuineaParaguayPeruPhilippinesPolandPortugalPost-demographic dividendPre-demographic dividendPuerto RicoQatarRomaniaRussian FederationRwandaSamoaSan MarinoSao Tome and PrincipeSaudi ArabiaSenegalSerbiaSeychellesSierra LeoneSingaporeSint Maarten (Dutch part)Slovak RepublicSloveniaSmall statesSolomon IslandsSomaliaSouth AfricaSouth AsiaSouth Asia (IDA & IBRD)South SudanSpainSri LankaSt. Kitts and NevisSt. LuciaSt. Vincent and the GrenadinesSub-Saharan Africa Sub-Saharan Africa (excluding high income)Sub-Saharan Africa (IDA & IBRD countries)SudanSurinameSwazilandSwedenSwitzerlandSyrian Arab RepublicTajikistanTanzaniaThailandTimor-LesteTogoTongaTrinidad and TobagoTunisiaTurkeyTurkmenistanTurks and Caicos IslandsTuvaluUgandaUkraineUnited Arab EmiratesUnited KingdomUnited StatesUpper middle incomeUruguayUzbekistanVanuatuVenezuela, RBVietnamWest Bank and GazaWorldYemen, Rep.ZambiaZimbabwe Timeline:
This timeline shows a graph from 1974 to 2015 of East Asia & Pacific. No data until 1973. Number of actual observations by date: 42.
Source name:
World Development Indicators
Source organization:
United Nations Educational, Scientific, and Cultural Organization (UNESCO) Institute for Statistics.
Categories, topics:
Education, Gender
Last updated:
apr 23, 2017
Indicators value changes by year
Minimum:
42.855
jan 1, 1975
Maximum:
47.912
jan 1, 2002
At the date of observation
Value
Absolute change
Change from previous value
jan 1, 1974
42.991
+42.991
0.0%
jan 1, 1975
42.855
-0.136
-0.32%
jan 1, 1976
44.97
+2.115
4.94%
jan 1, 1977
46.044
+1.074
2.39%
jan 1, 1978
46.24
+0.196
0.43%
jan 1, 1979
46.096
-0.144
-0.31%
jan 1, 1980
45.847
-0.249
-0.54%
jan 1, 1981
45.807
-0.04
-0.09%
jan 1, 1982
45.608
-0.198
-0.43%
jan 1, 1983
45.344
-0.265
-0.58%
jan 1, 1984
45.327
-0.017
-0.04%
jan 1, 1985
45.422
+0.095
0.21%
jan 1, 1986
45.497
+0.075
0.17%
jan 1, 1987
46.074
+0.577
1.27%
jan 1, 1988
46.317
+0.242
0.53%
jan 1, 1989
46.504
+0.187
0.4%
jan 1, 1990
46.724
+0.219
0.47%
jan 1, 1991
46.881
+0.157
0.34%
jan 1, 1992
47.168
+0.287
0.61%
jan 1, 1993
47.379
+0.211
0.45%
jan 1, 1994
47.379
0.0
0.0%
jan 1, 1995
47.523
+0.145
0.31%
jan 1, 1996
47.594
+0.07
0.15%
jan 1, 1997
47.695
+0.101
0.21%
jan 1, 1998
47.817
+0.122
0.26%
jan 1, 1999
47.796
-0.021
-0.04%
jan 1, 2000
47.868
+0.072
0.15%
jan 1, 2001
47.89
+0.022
0.05%
jan 1, 2002
47.912
+0.022
0.05%
jan 1, 2003
47.751
-0.161
-0.34%
jan 1, 2004
47.68
-0.071
-0.15%
jan 1, 2005
47.607
-0.074
-0.15%
jan 1, 2006
47.523
-0.084
-0.18%
jan 1, 2007
47.45
-0.072
-0.15%
jan 1, 2008
47.342
-0.108
-0.23%
jan 1, 2009
47.324
-0.018
-0.04%
jan 1, 2010
47.231
-0.093
-0.2%
jan 1, 2011
47.363
+0.132
0.28%
jan 1, 2012
47.338
-0.025
-0.05%
jan 1, 2013
47.211
-0.127
-0.27%
jan 1, 2014
47.231
+0.02
0.04%
jan 1, 2015
47.195
-0.037
-0.08%
Ranking of countries by current statistics by years


Comments: