29
/
en
AIzaSyAYiBZKx7MnpbEhh9jyipgxe19OcubqV5w
April 1, 2024
116185
Cuba
CUB
true
2
1
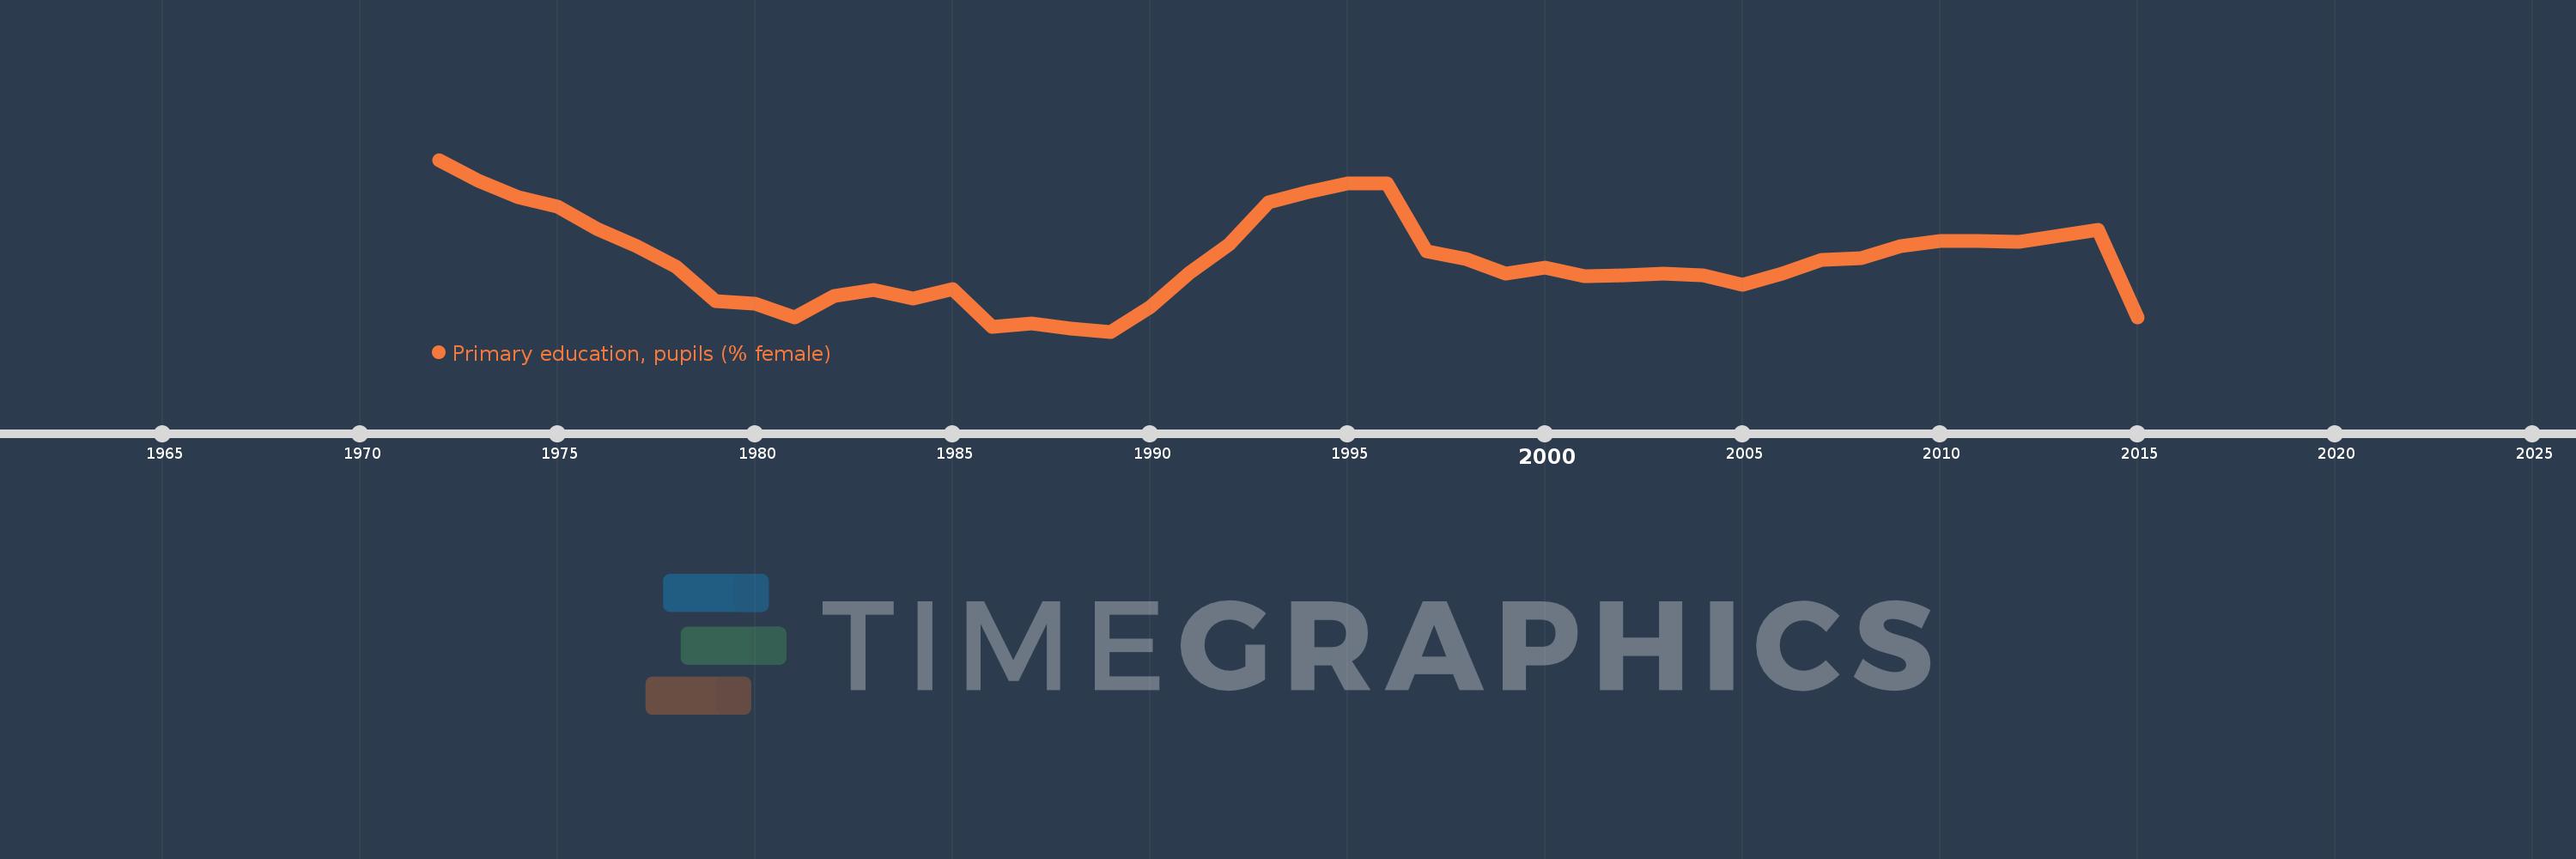
Primary education, pupils (% female)
2015,2014,2013,2012,2011,2010,2009,2008,2007,2006,2005,2004,2003,2002,2001,2000,1999,1998,1997,1996,1995,1994,1993,1992,1991,1990,1989,1988,1987,1986,1985,1984,1983,1982,1981,1980,1979,1978,1977,1976,1975,1974,1973,1972
This statistics in other country:
AfghanistanAlbaniaAlgeriaAndorraAngolaAntigua and BarbudaArab WorldArgentinaArmeniaArubaAustraliaAustriaAzerbaijanBahamas, TheBahrainBangladeshBarbadosBelarusBelgiumBelizeBeninBermudaBhutanBoliviaBosnia and HerzegovinaBotswanaBrazilBritish Virgin IslandsBrunei DarussalamBulgariaBurkina FasoBurundiCabo VerdeCambodiaCameroonCanadaCaribbean small statesCayman IslandsCentral African RepublicCentral Europe and the BalticsChadChileChinaColombiaComorosCongo, Dem. Rep.Congo, Rep.Costa RicaCote d'IvoireCroatiaCubaCuracaoCyprusCzech RepublicDenmarkDjiboutiDominicaDominican RepublicEarly-demographic dividendEast Asia & PacificEast Asia & Pacific (excluding high income)East Asia & Pacific (IDA & IBRD countries)EcuadorEgypt, Arab Rep.El SalvadorEquatorial GuineaEritreaEstoniaEthiopiaEuro areaEurope & Central AsiaEurope & Central Asia (excluding high income)Europe & Central Asia (IDA & IBRD countries)European UnionFijiFinlandFragile and conflict affected situationsFranceGabonGambia, TheGeorgiaGermanyGhanaGibraltarGreeceGrenadaGuatemalaGuineaGuinea-BissauGuyanaHaitiHeavily indebted poor countries (HIPC)High incomeHondurasHong Kong SAR, ChinaHungaryIBRD onlyIcelandIDA & IBRD totalIDA blendIDA onlyIDA totalIndiaIndonesiaIran, Islamic Rep.IraqIrelandIsraelItalyJamaicaJapanJordanKazakhstanKenyaKiribatiKorea, Dem. People’s Rep.Korea, Rep.KuwaitKyrgyz RepublicLao PDRLate-demographic dividendLatin America & Caribbean Latin America & Caribbean (excluding high income)Latin America & the Caribbean (IDA & IBRD countries)LatviaLeast developed countries: UN classificationLebanonLesothoLiberiaLibyaLiechtensteinLithuaniaLow & middle incomeLow incomeLower middle incomeLuxembourgMacao SAR, ChinaMacedonia, FYRMadagascarMalawiMalaysiaMaldivesMaliMaltaMarshall IslandsMauritaniaMauritiusMexicoMicronesia, Fed. Sts.Middle East & North AfricaMiddle East & North Africa (excluding high income)Middle East & North Africa (IDA & IBRD countries)Middle incomeMoldovaMonacoMongoliaMontenegroMoroccoMozambiqueMyanmarNamibiaNauruNepalNetherlandsNew ZealandNicaraguaNigerNigeriaNorth AmericaNorwayOECD membersOmanOther small statesPacific island small statesPakistanPalauPanamaPapua New GuineaParaguayPeruPhilippinesPolandPortugalPost-demographic dividendPre-demographic dividendPuerto RicoQatarRomaniaRussian FederationRwandaSamoaSan MarinoSao Tome and PrincipeSaudi ArabiaSenegalSerbiaSeychellesSierra LeoneSingaporeSint Maarten (Dutch part)Slovak RepublicSloveniaSmall statesSolomon IslandsSomaliaSouth AfricaSouth AsiaSouth Asia (IDA & IBRD)South SudanSpainSri LankaSt. Kitts and NevisSt. LuciaSt. Vincent and the GrenadinesSub-Saharan Africa Sub-Saharan Africa (excluding high income)Sub-Saharan Africa (IDA & IBRD countries)SudanSurinameSwazilandSwedenSwitzerlandSyrian Arab RepublicTajikistanTanzaniaThailandTimor-LesteTogoTongaTrinidad and TobagoTunisiaTurkeyTurkmenistanTurks and Caicos IslandsTuvaluUgandaUkraineUnited Arab EmiratesUnited KingdomUnited StatesUpper middle incomeUruguayUzbekistanVanuatuVenezuela, RBVietnamWest Bank and GazaWorldYemen, Rep.ZambiaZimbabwe Timeline:
This timeline shows a graph from 1972 to 2015 of Cuba. No data until 1971. Number of actual observations by date: 44.
Source name:
World Development Indicators
Source organization:
United Nations Educational, Scientific, and Cultural Organization (UNESCO) Institute for Statistics.
Categories, topics:
Education, Gender
Last updated:
apr 23, 2017
Indicators value changes by year
Minimum:
47.173
jan 1, 1989
Maximum:
48.921
jan 1, 1972
At the date of observation
Value
Absolute change
Change from previous value
jan 1, 1972
48.921
+48.921
0.0%
jan 1, 1973
48.705
-0.216
-0.44%
jan 1, 1974
48.54
-0.164
-0.34%
jan 1, 1975
48.446
-0.095
-0.2%
jan 1, 1976
48.219
-0.227
-0.47%
jan 1, 1977
48.04
-0.178
-0.37%
jan 1, 1978
47.832
-0.209
-0.43%
jan 1, 1979
47.479
-0.353
-0.74%
jan 1, 1980
47.453
-0.026
-0.05%
jan 1, 1981
47.316
-0.137
-0.29%
jan 1, 1982
47.54
+0.224
0.47%
jan 1, 1983
47.593
+0.053
0.11%
jan 1, 1984
47.512
-0.081
-0.17%
jan 1, 1985
47.606
+0.094
0.2%
jan 1, 1986
47.223
-0.383
-0.8%
jan 1, 1987
47.257
+0.033
0.07%
jan 1, 1988
47.2
-0.057
-0.12%
jan 1, 1989
47.173
-0.028
-0.06%
jan 1, 1990
47.423
+0.25
0.53%
jan 1, 1991
47.768
+0.345
0.73%
jan 1, 1992
48.056
+0.288
0.6%
jan 1, 1993
48.489
+0.433
0.9%
jan 1, 1994
48.594
+0.105
0.22%
jan 1, 1995
48.68
+0.086
0.18%
jan 1, 1996
48.684
+0.004
0.01%
jan 1, 1997
47.992
-0.692
-1.42%
jan 1, 1998
47.912
-0.079
-0.17%
jan 1, 1999
47.761
-0.152
-0.32%
jan 1, 2000
47.824
+0.063
0.13%
jan 1, 2001
47.738
-0.086
-0.18%
jan 1, 2002
47.742
+0.004
0.01%
jan 1, 2003
47.76
+0.017
0.04%
jan 1, 2004
47.742
-0.017
-0.04%
jan 1, 2005
47.653
-0.089
-0.19%
jan 1, 2006
47.764
+0.111
0.23%
jan 1, 2007
47.903
+0.139
0.29%
jan 1, 2008
47.924
+0.021
0.04%
jan 1, 2009
48.041
+0.117
0.24%
jan 1, 2010
48.094
+0.053
0.11%
jan 1, 2011
48.093
-0.001
0.0%
jan 1, 2012
48.09
-0.003
-0.01%
jan 1, 2013
48.144
+0.055
0.11%
jan 1, 2014
48.207
+0.062
0.13%
jan 1, 2015
47.32
-0.887
-1.84%
Ranking of countries by current statistics by years


Comments: