29
/
en
AIzaSyAYiBZKx7MnpbEhh9jyipgxe19OcubqV5w
April 1, 2024
232718
Samoa
WSM
true
2
1
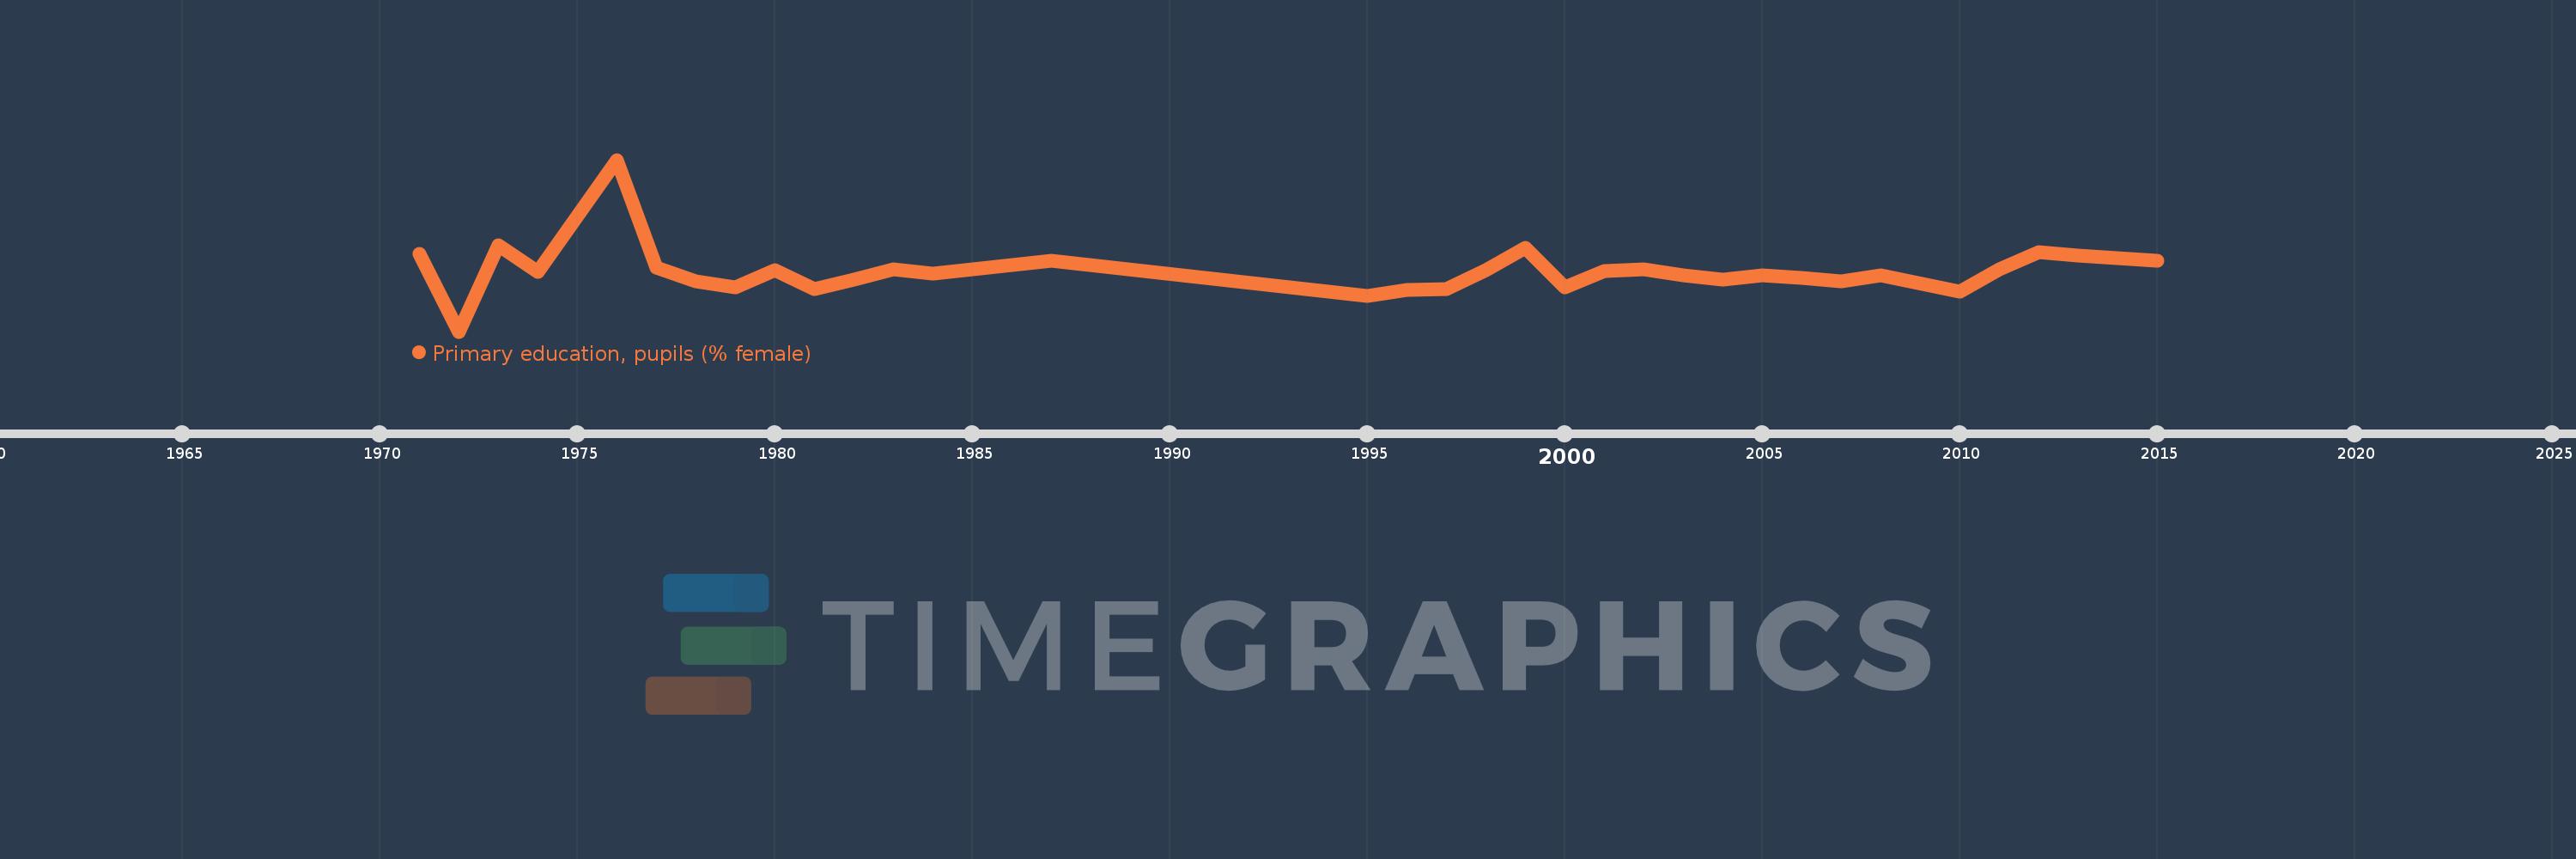
Primary education, pupils (% female)
2015,2013,2012,2011,2010,2008,2007,2006,2005,2004,2003,2002,2001,2000,1999,1998,1997,1996,1995,1987,1984,1983,1982,1981,1980,1979,1978,1977,1976,1974,1973,1972,1971
This statistics in other country:
AfghanistanAlbaniaAlgeriaAndorraAngolaAntigua and BarbudaArab WorldArgentinaArmeniaArubaAustraliaAustriaAzerbaijanBahamas, TheBahrainBangladeshBarbadosBelarusBelgiumBelizeBeninBermudaBhutanBoliviaBosnia and HerzegovinaBotswanaBrazilBritish Virgin IslandsBrunei DarussalamBulgariaBurkina FasoBurundiCabo VerdeCambodiaCameroonCanadaCaribbean small statesCayman IslandsCentral African RepublicCentral Europe and the BalticsChadChileChinaColombiaComorosCongo, Dem. Rep.Congo, Rep.Costa RicaCote d'IvoireCroatiaCubaCuracaoCyprusCzech RepublicDenmarkDjiboutiDominicaDominican RepublicEarly-demographic dividendEast Asia & PacificEast Asia & Pacific (excluding high income)East Asia & Pacific (IDA & IBRD countries)EcuadorEgypt, Arab Rep.El SalvadorEquatorial GuineaEritreaEstoniaEthiopiaEuro areaEurope & Central AsiaEurope & Central Asia (excluding high income)Europe & Central Asia (IDA & IBRD countries)European UnionFijiFinlandFragile and conflict affected situationsFranceGabonGambia, TheGeorgiaGermanyGhanaGibraltarGreeceGrenadaGuatemalaGuineaGuinea-BissauGuyanaHaitiHeavily indebted poor countries (HIPC)High incomeHondurasHong Kong SAR, ChinaHungaryIBRD onlyIcelandIDA & IBRD totalIDA blendIDA onlyIDA totalIndiaIndonesiaIran, Islamic Rep.IraqIrelandIsraelItalyJamaicaJapanJordanKazakhstanKenyaKiribatiKorea, Dem. People’s Rep.Korea, Rep.KuwaitKyrgyz RepublicLao PDRLate-demographic dividendLatin America & Caribbean Latin America & Caribbean (excluding high income)Latin America & the Caribbean (IDA & IBRD countries)LatviaLeast developed countries: UN classificationLebanonLesothoLiberiaLibyaLiechtensteinLithuaniaLow & middle incomeLow incomeLower middle incomeLuxembourgMacao SAR, ChinaMacedonia, FYRMadagascarMalawiMalaysiaMaldivesMaliMaltaMarshall IslandsMauritaniaMauritiusMexicoMicronesia, Fed. Sts.Middle East & North AfricaMiddle East & North Africa (excluding high income)Middle East & North Africa (IDA & IBRD countries)Middle incomeMoldovaMonacoMongoliaMontenegroMoroccoMozambiqueMyanmarNamibiaNauruNepalNetherlandsNew ZealandNicaraguaNigerNigeriaNorth AmericaNorwayOECD membersOmanOther small statesPacific island small statesPakistanPalauPanamaPapua New GuineaParaguayPeruPhilippinesPolandPortugalPost-demographic dividendPre-demographic dividendPuerto RicoQatarRomaniaRussian FederationRwandaSamoaSan MarinoSao Tome and PrincipeSaudi ArabiaSenegalSerbiaSeychellesSierra LeoneSingaporeSint Maarten (Dutch part)Slovak RepublicSloveniaSmall statesSolomon IslandsSomaliaSouth AfricaSouth AsiaSouth Asia (IDA & IBRD)South SudanSpainSri LankaSt. Kitts and NevisSt. LuciaSt. Vincent and the GrenadinesSub-Saharan Africa Sub-Saharan Africa (excluding high income)Sub-Saharan Africa (IDA & IBRD countries)SudanSurinameSwazilandSwedenSwitzerlandSyrian Arab RepublicTajikistanTanzaniaThailandTimor-LesteTogoTongaTrinidad and TobagoTunisiaTurkeyTurkmenistanTurks and Caicos IslandsTuvaluUgandaUkraineUnited Arab EmiratesUnited KingdomUnited StatesUpper middle incomeUruguayUzbekistanVanuatuVenezuela, RBVietnamWest Bank and GazaWorldYemen, Rep.ZambiaZimbabwe Timeline:
This timeline shows a graph from 1971 to 2015 of Samoa. No data until 1970. Number of actual observations by date: 33.
Source name:
World Development Indicators
Source organization:
United Nations Educational, Scientific, and Cultural Organization (UNESCO) Institute for Statistics.
Categories, topics:
Education, Gender
Last updated:
apr 23, 2017
Indicators value changes by year
Minimum:
46.441
jan 1, 1972
Maximum:
51.092
jan 1, 1976
At the date of observation
Value
Absolute change
Change from previous value
jan 1, 1971
48.537
+48.537
0.0%
jan 1, 1972
46.441
-2.096
-4.32%
jan 1, 1973
48.779
+2.339
5.04%
jan 1, 1974
48.066
-0.713
-1.46%
jan 1, 1976
51.092
+3.025
6.29%
jan 1, 1977
48.168
-2.924
-5.72%
jan 1, 1978
47.796
-0.371
-0.77%
jan 1, 1979
47.636
-0.16
-0.34%
jan 1, 1980
48.104
+0.468
0.98%
jan 1, 1981
47.601
-0.503
-1.05%
jan 1, 1982
47.855
+0.254
0.53%
jan 1, 1983
48.126
+0.27
0.57%
jan 1, 1984
48.02
-0.106
-0.22%
jan 1, 1987
48.367
+0.348
0.72%
jan 1, 1995
47.397
-0.97
-2.01%
jan 1, 1996
47.562
+0.165
0.35%
jan 1, 1997
47.595
+0.033
0.07%
jan 1, 1998
48.095
+0.499
1.05%
jan 1, 1999
48.697
+0.603
1.25%
jan 1, 2000
47.65
-1.047
-2.15%
jan 1, 2001
48.091
+0.441
0.93%
jan 1, 2002
48.118
+0.027
0.06%
jan 1, 2003
47.966
-0.152
-0.32%
jan 1, 2004
47.844
-0.122
-0.25%
jan 1, 2005
47.965
+0.12
0.25%
jan 1, 2006
47.885
-0.08
-0.17%
jan 1, 2007
47.801
-0.083
-0.17%
jan 1, 2008
47.955
+0.154
0.32%
jan 1, 2010
47.514
-0.441
-0.92%
jan 1, 2011
48.116
+0.603
1.27%
jan 1, 2012
48.583
+0.467
0.97%
jan 1, 2013
48.505
-0.078
-0.16%
jan 1, 2015
48.37
-0.135
-0.28%
Ranking of countries by current statistics by years


Comments: