29
/
en
AIzaSyAYiBZKx7MnpbEhh9jyipgxe19OcubqV5w
April 1, 2024
96499
Burundi
BDI
true
2
1
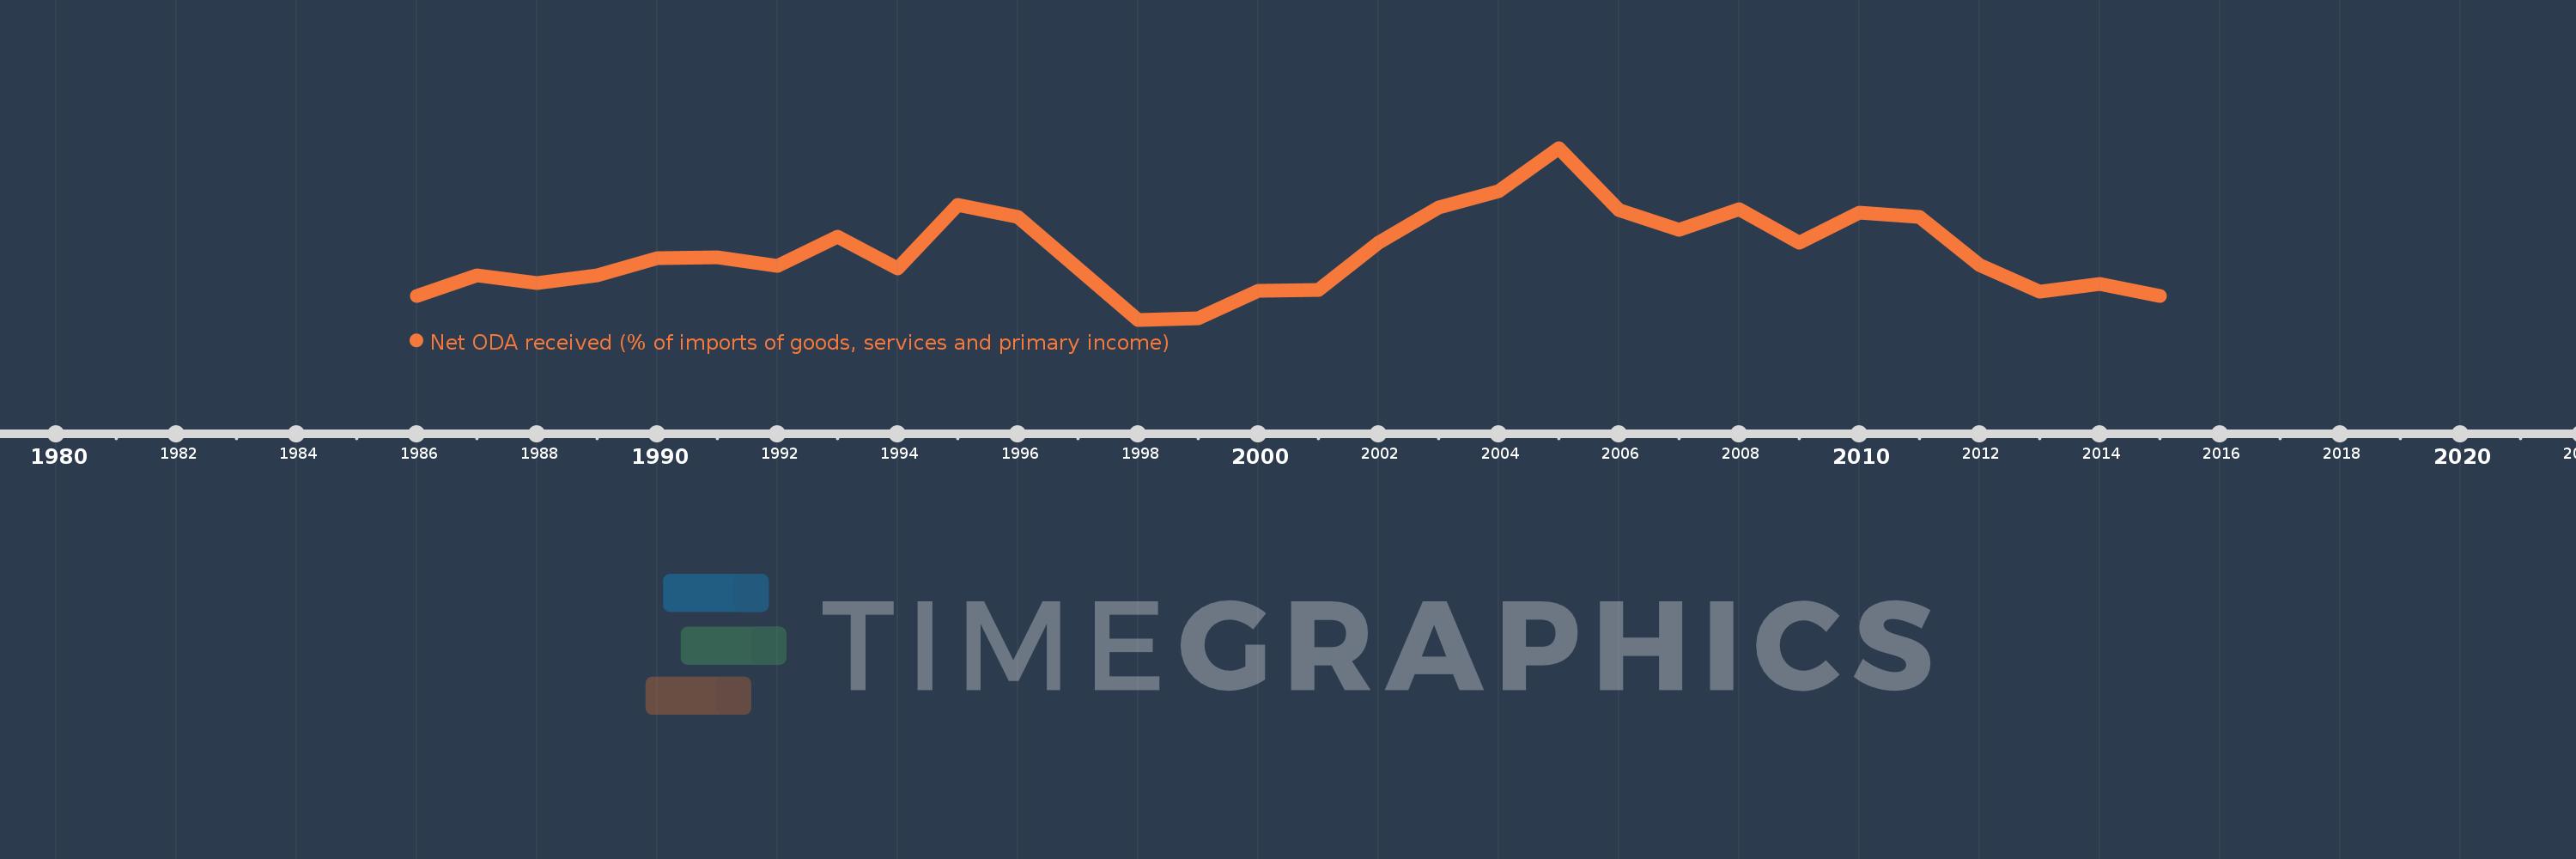
Net ODA received (% of imports of goods, services and primary income)
2015,2014,2013,2012,2011,2010,2009,2008,2007,2006,2005,2004,2003,2002,2001,2000,1999,1998,1997,1996,1995,1994,1993,1992,1991,1990,1989,1988,1987,1986
This statistics in other country:
AfghanistanAlbaniaAlgeriaAngolaAntigua and BarbudaArab WorldArgentinaArmeniaArubaAzerbaijanBahamas, TheBahrainBangladeshBarbadosBelarusBelizeBeninBhutanBoliviaBosnia and HerzegovinaBotswanaBrazilBurkina FasoBurundiCabo VerdeCambodiaCameroonCaribbean small statesCentral African RepublicCentral Europe and the BalticsChadChileChinaColombiaComorosCongo, Dem. Rep.Congo, Rep.Costa RicaCote d'IvoireCroatiaCyprusDjiboutiDominicaDominican RepublicEast Asia & PacificEast Asia & Pacific (excluding high income)East Asia & Pacific (IDA & IBRD countries)EcuadorEgypt, Arab Rep.El SalvadorEquatorial GuineaEritreaEthiopiaEuro areaEurope & Central AsiaEurope & Central Asia (excluding high income)Europe & Central Asia (IDA & IBRD countries)European UnionFijiFragile and conflict affected situationsGabonGambia, TheGeorgiaGhanaGrenadaGuatemalaGuineaGuinea-BissauGuyanaHaitiHeavily indebted poor countries (HIPC)High incomeHondurasIBRD onlyIDA & IBRD totalIDA blendIDA onlyIDA totalIndiaIndonesiaIran, Islamic Rep.IraqIsraelJamaicaJordanKazakhstanKenyaKiribatiKorea, Rep.KosovoKuwaitKyrgyz RepublicLao PDRLatin America & Caribbean Latin America & Caribbean (excluding high income)Latin America & the Caribbean (IDA & IBRD countries)Least developed countries: UN classificationLebanonLesothoLiberiaLibyaLow & middle incomeLow incomeLower middle incomeMacedonia, FYRMadagascarMalawiMalaysiaMaldivesMaliMaltaMarshall IslandsMauritaniaMauritiusMexicoMicronesia, Fed. Sts.Middle East & North Africa (excluding high income)Middle East & North Africa (IDA & IBRD countries)Middle incomeMoldovaMongoliaMontenegroMoroccoMozambiqueMyanmarNamibiaNepalNicaraguaNigerNigeriaNorth AmericaOECD membersOmanOther small statesPacific island small statesPakistanPalauPanamaPapua New GuineaParaguayPeruPhilippinesRwandaSamoaSao Tome and PrincipeSaudi ArabiaSenegalSerbiaSeychellesSierra LeoneSingaporeSloveniaSmall statesSolomon IslandsSouth AfricaSouth AsiaSouth Asia (IDA & IBRD)South SudanSri LankaSt. Kitts and NevisSt. LuciaSt. Vincent and the GrenadinesSub-Saharan Africa Sub-Saharan Africa (excluding high income)Sub-Saharan Africa (IDA & IBRD countries)SudanSurinameSwazilandSyrian Arab RepublicTajikistanTanzaniaThailandTimor-LesteTogoTongaTrinidad and TobagoTunisiaTurkeyTuvaluUgandaUkraineUpper middle incomeUruguayVanuatuVenezuela, RBVietnamWest Bank and GazaWorldYemen, Rep.ZambiaZimbabwe Timeline:
This timeline shows a graph from 1986 to 2015 of Burundi. No data until 1985. Number of actual observations by date: 30.
Source name:
World Development Indicators
Source organization:
Development Assistance Committee of the Organisation for Economic Co-operation and Development, Geographical Distribution of Financial Flows to Developing Countries, Development Co-operation Report, and International Development Statistics database. Data are available online at: www.oecd.org/dac/stats/idsonline. World Bank imports of good and services estimates are used for the denominator.
Categories, topics:
Aid Effectiveness
Last updated:
apr 23, 2017
Indicators value changes by year
Minimum:
38.201
jan 1, 1998
Maximum:
144.153
jan 1, 2005
At the date of observation
Value
Absolute change
Change from previous value
jan 1, 1986
52.979
+52.979
0.0%
jan 1, 1987
65.77
+12.79
24.14%
jan 1, 1988
60.959
-4.811
-7.31%
jan 1, 1989
65.361
+4.403
7.22%
jan 1, 1990
76.241
+10.88
16.65%
jan 1, 1991
76.933
+0.692
0.91%
jan 1, 1992
71.633
-5.3
-6.89%
jan 1, 1993
89.215
+17.582
24.54%
jan 1, 1994
70.015
-19.2
-21.52%
jan 1, 1995
108.786
+38.771
55.38%
jan 1, 1996
101.824
-6.962
-6.4%
jan 1, 1997
69.625
-32.199
-31.62%
jan 1, 1998
38.201
-31.424
-45.13%
jan 1, 1999
38.908
+0.707
1.85%
jan 1, 2000
56.121
+17.214
44.24%
jan 1, 2001
56.457
+0.336
0.6%
jan 1, 2002
85.811
+29.354
51.99%
jan 1, 2003
107.515
+21.703
25.29%
jan 1, 2004
117.504
+9.99
9.29%
jan 1, 2005
144.153
+26.649
22.68%
jan 1, 2006
105.824
-38.329
-26.59%
jan 1, 2007
93.597
-12.227
-11.55%
jan 1, 2008
106.253
+12.657
13.52%
jan 1, 2009
85.694
-20.56
-19.35%
jan 1, 2010
104.341
+18.647
21.76%
jan 1, 2011
101.73
-2.611
-2.5%
jan 1, 2012
72.183
-29.547
-29.04%
jan 1, 2013
55.267
-16.916
-23.43%
jan 1, 2014
60.048
+4.781
8.65%
jan 1, 2015
53.085
-6.962
-11.59%
Ranking of countries by current statistics by years


Comments: