29
/
en
AIzaSyAYiBZKx7MnpbEhh9jyipgxe19OcubqV5w
April 1, 2024
40174
IDA total
IDA
false
2
1
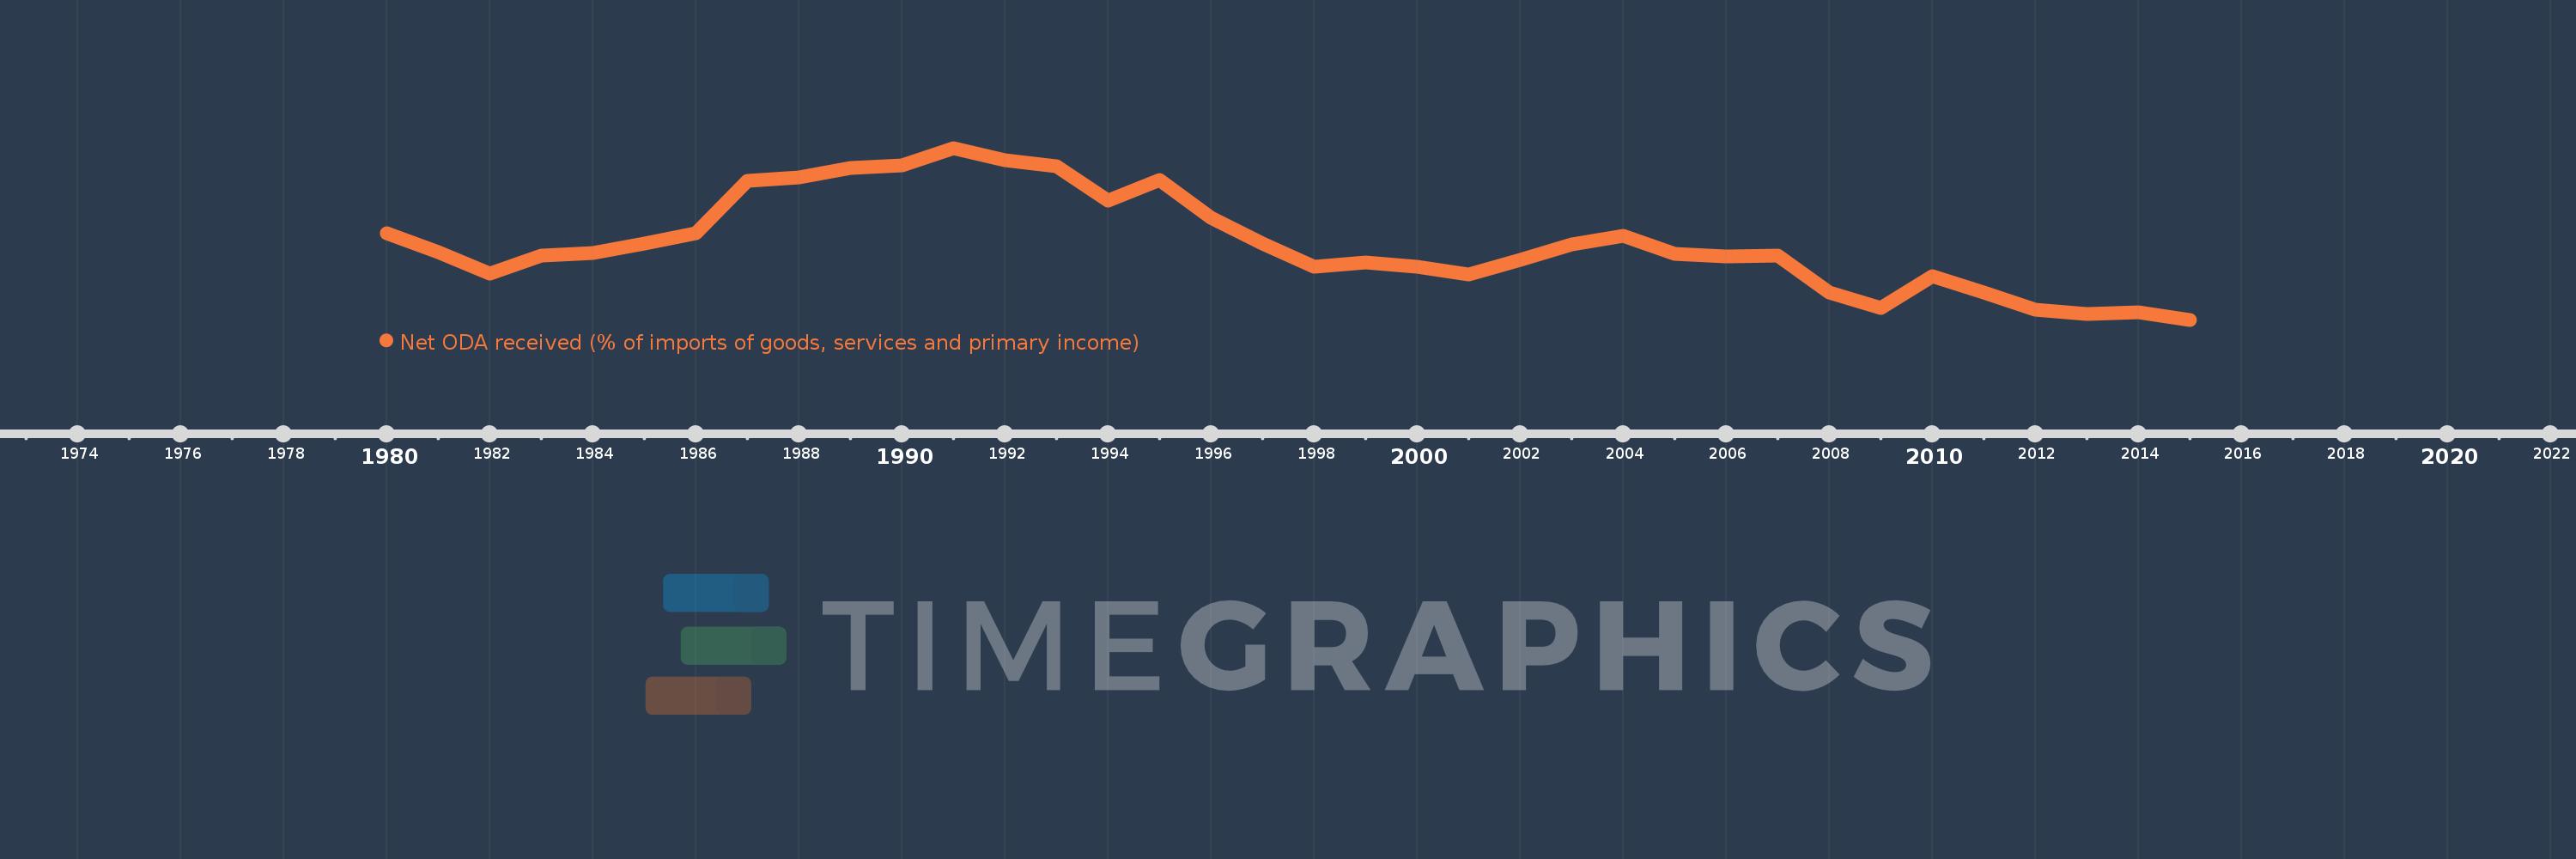
Net ODA received (% of imports of goods, services and primary income)
2015,2014,2013,2012,2011,2010,2009,2008,2007,2006,2005,2004,2003,2002,2001,2000,1999,1998,1997,1996,1995,1994,1993,1992,1991,1990,1989,1988,1987,1986,1985,1984,1983,1982,1981,1980
This statistics in other country:
AfghanistanAlbaniaAlgeriaAngolaAntigua and BarbudaArab WorldArgentinaArmeniaArubaAzerbaijanBahamas, TheBahrainBangladeshBarbadosBelarusBelizeBeninBhutanBoliviaBosnia and HerzegovinaBotswanaBrazilBurkina FasoBurundiCabo VerdeCambodiaCameroonCaribbean small statesCentral African RepublicCentral Europe and the BalticsChadChileChinaColombiaComorosCongo, Dem. Rep.Congo, Rep.Costa RicaCote d'IvoireCroatiaCyprusDjiboutiDominicaDominican RepublicEast Asia & PacificEast Asia & Pacific (excluding high income)East Asia & Pacific (IDA & IBRD countries)EcuadorEgypt, Arab Rep.El SalvadorEquatorial GuineaEritreaEthiopiaEuro areaEurope & Central AsiaEurope & Central Asia (excluding high income)Europe & Central Asia (IDA & IBRD countries)European UnionFijiFragile and conflict affected situationsGabonGambia, TheGeorgiaGhanaGrenadaGuatemalaGuineaGuinea-BissauGuyanaHaitiHeavily indebted poor countries (HIPC)High incomeHondurasIBRD onlyIDA & IBRD totalIDA blendIDA onlyIDA totalIndiaIndonesiaIran, Islamic Rep.IraqIsraelJamaicaJordanKazakhstanKenyaKiribatiKorea, Rep.KosovoKuwaitKyrgyz RepublicLao PDRLatin America & Caribbean Latin America & Caribbean (excluding high income)Latin America & the Caribbean (IDA & IBRD countries)Least developed countries: UN classificationLebanonLesothoLiberiaLibyaLow & middle incomeLow incomeLower middle incomeMacedonia, FYRMadagascarMalawiMalaysiaMaldivesMaliMaltaMarshall IslandsMauritaniaMauritiusMexicoMicronesia, Fed. Sts.Middle East & North Africa (excluding high income)Middle East & North Africa (IDA & IBRD countries)Middle incomeMoldovaMongoliaMontenegroMoroccoMozambiqueMyanmarNamibiaNepalNicaraguaNigerNigeriaNorth AmericaOECD membersOmanOther small statesPacific island small statesPakistanPalauPanamaPapua New GuineaParaguayPeruPhilippinesRwandaSamoaSao Tome and PrincipeSaudi ArabiaSenegalSerbiaSeychellesSierra LeoneSingaporeSloveniaSmall statesSolomon IslandsSouth AfricaSouth AsiaSouth Asia (IDA & IBRD)South SudanSri LankaSt. Kitts and NevisSt. LuciaSt. Vincent and the GrenadinesSub-Saharan Africa Sub-Saharan Africa (excluding high income)Sub-Saharan Africa (IDA & IBRD countries)SudanSurinameSwazilandSyrian Arab RepublicTajikistanTanzaniaThailandTimor-LesteTogoTongaTrinidad and TobagoTunisiaTurkeyTuvaluUgandaUkraineUpper middle incomeUruguayVanuatuVenezuela, RBVietnamWest Bank and GazaWorldYemen, Rep.ZambiaZimbabwe Timeline:
This timeline shows a graph from 1980 to 2015 of IDA total. No data until 1979. Number of actual observations by date: 36.
Source name:
World Development Indicators
Source organization:
Development Assistance Committee of the Organisation for Economic Co-operation and Development, Geographical Distribution of Financial Flows to Developing Countries, Development Co-operation Report, and International Development Statistics database. Data are available online at: www.oecd.org/dac/stats/idsonline. World Bank imports of good and services estimates are used for the denominator.
Categories, topics:
Aid Effectiveness
Last updated:
apr 23, 2017
Indicators value changes by year
Maximum:
26.249
jan 1, 1991
At the date of observation
Value
Absolute change
Change from previous value
jan 1, 1980
17.365
+17.365
0.0%
jan 1, 1981
15.377
-1.988
-11.45%
jan 1, 1982
13.165
-2.211
-14.38%
jan 1, 1983
15.022
+1.857
14.1%
jan 1, 1984
15.259
+0.237
1.58%
jan 1, 1985
16.271
+1.011
6.63%
jan 1, 1986
17.317
+1.046
6.43%
jan 1, 1987
22.774
+5.457
31.51%
jan 1, 1988
23.146
+0.372
1.63%
jan 1, 1989
24.118
+0.972
4.2%
jan 1, 1990
24.423
+0.305
1.26%
jan 1, 1991
26.249
+1.826
7.48%
jan 1, 1992
24.934
-1.315
-5.01%
jan 1, 1993
24.33
-0.604
-2.42%
jan 1, 1994
20.712
-3.618
-14.87%
jan 1, 1995
22.912
+2.2
10.62%
jan 1, 1996
18.938
-3.974
-17.35%
jan 1, 1997
16.239
-2.699
-14.25%
jan 1, 1998
13.878
-2.361
-14.54%
jan 1, 1999
14.27
+0.393
2.83%
jan 1, 2000
13.83
-0.44
-3.08%
jan 1, 2001
13.053
-0.778
-5.62%
jan 1, 2002
14.532
+1.48
11.34%
jan 1, 2003
16.16
+1.628
11.2%
jan 1, 2004
17.064
+0.904
5.59%
jan 1, 2005
15.221
-1.843
-10.8%
jan 1, 2006
14.924
-0.297
-1.95%
jan 1, 2007
15.029
+0.104
0.7%
jan 1, 2008
11.162
-3.867
-25.73%
jan 1, 2009
9.511
-1.651
-14.79%
jan 1, 2010
12.87
+3.359
35.32%
jan 1, 2011
11.124
-1.747
-13.57%
jan 1, 2012
9.344
-1.78
-16.0%
jan 1, 2013
8.879
-0.465
-4.98%
jan 1, 2014
9.106
+0.227
2.56%
jan 1, 2015
8.314
-0.792
-8.69%
Ranking of countries by current statistics by years


Comments: