29
/
en
AIzaSyAYiBZKx7MnpbEhh9jyipgxe19OcubqV5w
April 1, 2024
219934
Papua New Guinea
PNG
true
2
1
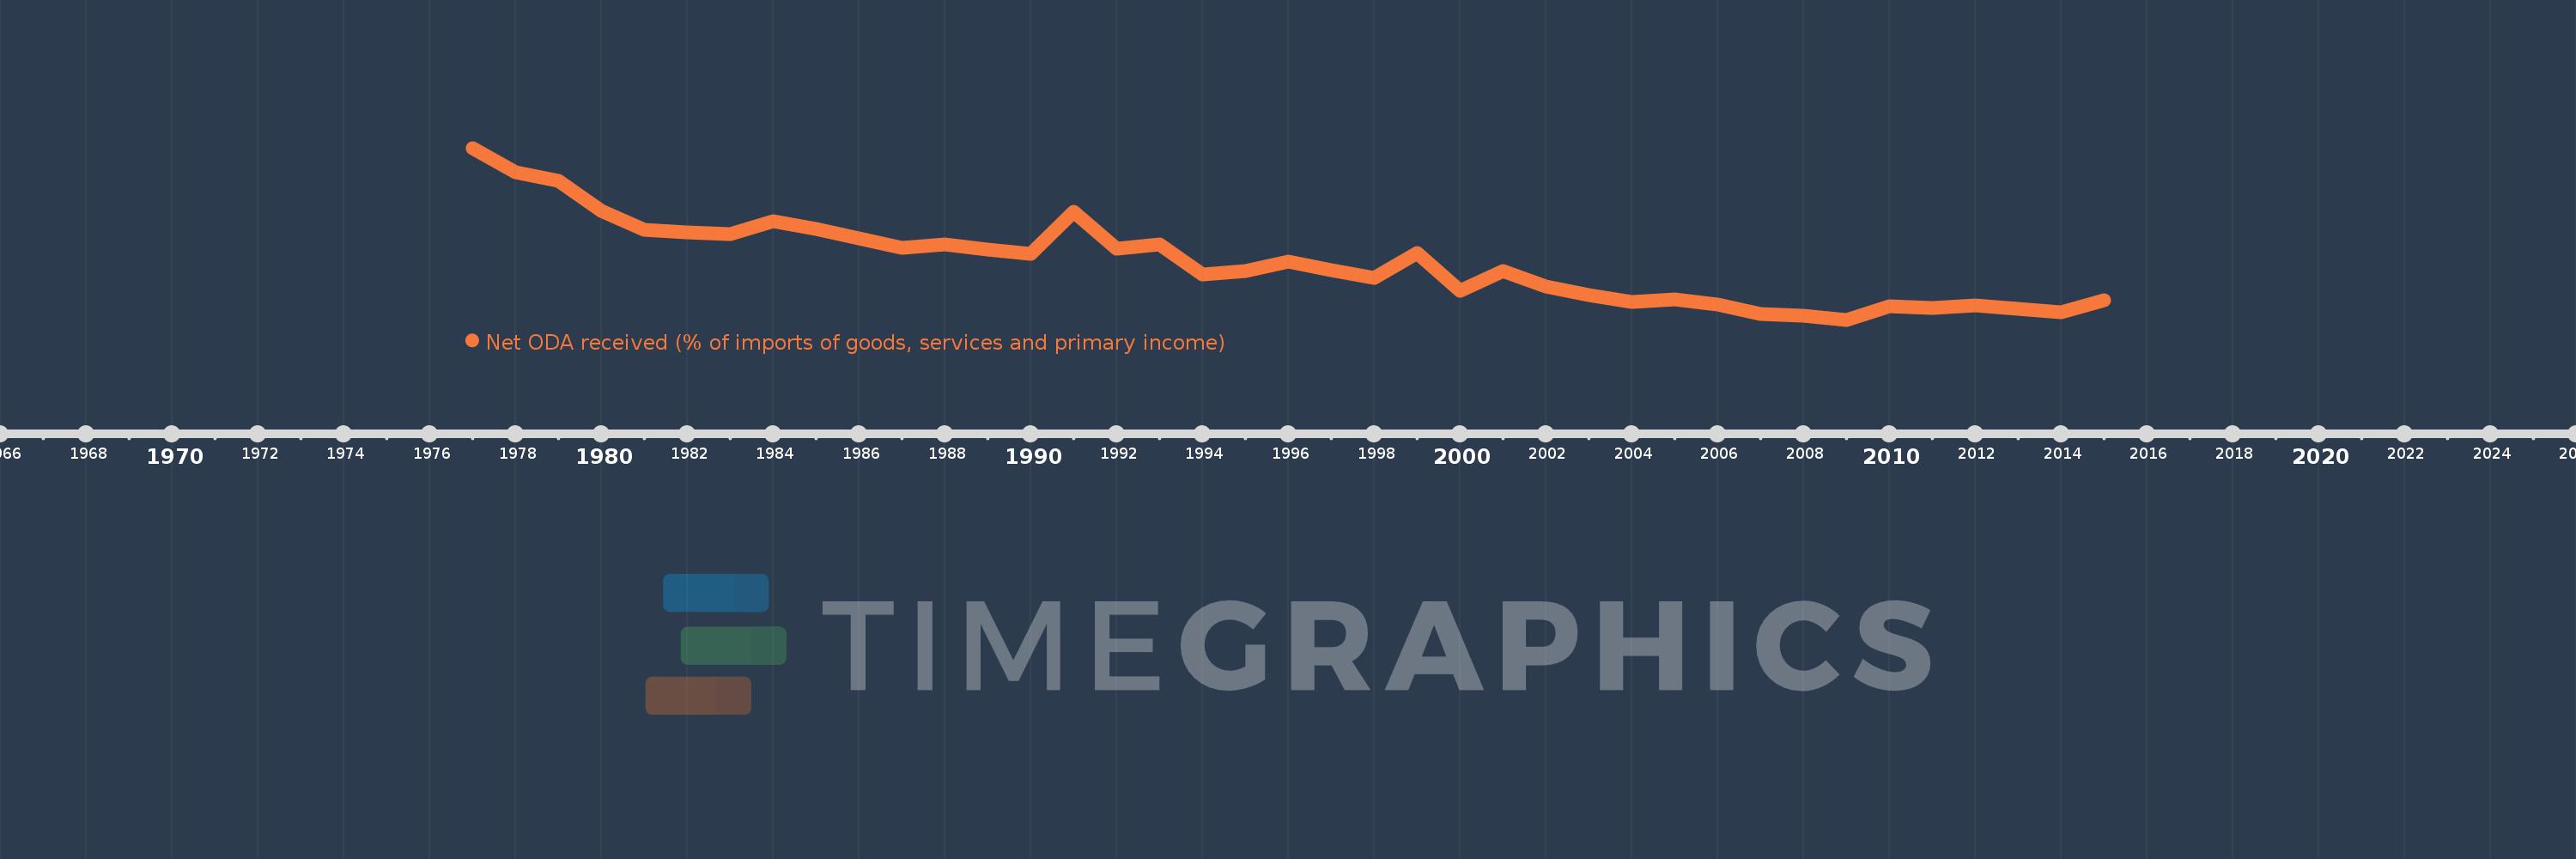
Net ODA received (% of imports of goods, services and primary income)
2015,2014,2013,2012,2011,2010,2009,2008,2007,2006,2005,2004,2003,2002,2001,2000,1999,1998,1997,1996,1995,1994,1993,1992,1991,1990,1989,1988,1987,1986,1985,1984,1983,1982,1981,1980,1979,1978,1977
This statistics in other country:
AfghanistanAlbaniaAlgeriaAngolaAntigua and BarbudaArab WorldArgentinaArmeniaArubaAzerbaijanBahamas, TheBahrainBangladeshBarbadosBelarusBelizeBeninBhutanBoliviaBosnia and HerzegovinaBotswanaBrazilBurkina FasoBurundiCabo VerdeCambodiaCameroonCaribbean small statesCentral African RepublicCentral Europe and the BalticsChadChileChinaColombiaComorosCongo, Dem. Rep.Congo, Rep.Costa RicaCote d'IvoireCroatiaCyprusDjiboutiDominicaDominican RepublicEast Asia & PacificEast Asia & Pacific (excluding high income)East Asia & Pacific (IDA & IBRD countries)EcuadorEgypt, Arab Rep.El SalvadorEquatorial GuineaEritreaEthiopiaEuro areaEurope & Central AsiaEurope & Central Asia (excluding high income)Europe & Central Asia (IDA & IBRD countries)European UnionFijiFragile and conflict affected situationsGabonGambia, TheGeorgiaGhanaGrenadaGuatemalaGuineaGuinea-BissauGuyanaHaitiHeavily indebted poor countries (HIPC)High incomeHondurasIBRD onlyIDA & IBRD totalIDA blendIDA onlyIDA totalIndiaIndonesiaIran, Islamic Rep.IraqIsraelJamaicaJordanKazakhstanKenyaKiribatiKorea, Rep.KosovoKuwaitKyrgyz RepublicLao PDRLatin America & Caribbean Latin America & Caribbean (excluding high income)Latin America & the Caribbean (IDA & IBRD countries)Least developed countries: UN classificationLebanonLesothoLiberiaLibyaLow & middle incomeLow incomeLower middle incomeMacedonia, FYRMadagascarMalawiMalaysiaMaldivesMaliMaltaMarshall IslandsMauritaniaMauritiusMexicoMicronesia, Fed. Sts.Middle East & North Africa (excluding high income)Middle East & North Africa (IDA & IBRD countries)Middle incomeMoldovaMongoliaMontenegroMoroccoMozambiqueMyanmarNamibiaNepalNicaraguaNigerNigeriaNorth AmericaOECD membersOmanOther small statesPacific island small statesPakistanPalauPanamaPapua New GuineaParaguayPeruPhilippinesRwandaSamoaSao Tome and PrincipeSaudi ArabiaSenegalSerbiaSeychellesSierra LeoneSingaporeSloveniaSmall statesSolomon IslandsSouth AfricaSouth AsiaSouth Asia (IDA & IBRD)South SudanSri LankaSt. Kitts and NevisSt. LuciaSt. Vincent and the GrenadinesSub-Saharan Africa Sub-Saharan Africa (excluding high income)Sub-Saharan Africa (IDA & IBRD countries)SudanSurinameSwazilandSyrian Arab RepublicTajikistanTanzaniaThailandTimor-LesteTogoTongaTrinidad and TobagoTunisiaTurkeyTuvaluUgandaUkraineUpper middle incomeUruguayVanuatuVenezuela, RBVietnamWest Bank and GazaWorldYemen, Rep.ZambiaZimbabwe Timeline:
This timeline shows a graph from 1977 to 2015 of Papua New Guinea. No data until 1976. Number of actual observations by date: 39.
Source name:
World Development Indicators
Source organization:
Development Assistance Committee of the Organisation for Economic Co-operation and Development, Geographical Distribution of Financial Flows to Developing Countries, Development Co-operation Report, and International Development Statistics database. Data are available online at: www.oecd.org/dac/stats/idsonline. World Bank imports of good and services estimates are used for the denominator.
Categories, topics:
Aid Effectiveness
Last updated:
apr 23, 2017
Indicators value changes by year
Maximum:
35.059
jan 1, 1977
At the date of observation
Value
Absolute change
Change from previous value
jan 1, 1977
35.059
+35.059
0.0%
jan 1, 1978
30.9
-4.159
-11.86%
jan 1, 1979
29.305
-1.595
-5.16%
jan 1, 1980
24.075
-5.23
-17.85%
jan 1, 1981
20.853
-3.222
-13.38%
jan 1, 1982
20.357
-0.497
-2.38%
jan 1, 1983
20.069
-0.287
-1.41%
jan 1, 1984
22.341
+2.271
11.32%
jan 1, 1985
21.073
-1.268
-5.68%
jan 1, 1986
19.402
-1.671
-7.93%
jan 1, 1987
17.741
-1.661
-8.56%
jan 1, 1988
18.39
+0.649
3.66%
jan 1, 1989
17.435
-0.955
-5.19%
jan 1, 1990
16.711
-0.724
-4.15%
jan 1, 1991
23.995
+7.284
43.58%
jan 1, 1992
17.569
-6.425
-26.78%
jan 1, 1993
18.289
+0.72
4.1%
jan 1, 1994
13.081
-5.209
-28.48%
jan 1, 1995
13.705
+0.624
4.77%
jan 1, 1996
15.33
+1.625
11.86%
jan 1, 1997
13.85
-1.48
-9.65%
jan 1, 1998
12.587
-1.263
-9.12%
jan 1, 1999
16.8
+4.213
33.47%
jan 1, 2000
10.331
-6.468
-38.5%
jan 1, 2001
13.667
+3.336
32.29%
jan 1, 2002
10.997
-2.671
-19.54%
jan 1, 2003
9.614
-1.383
-12.57%
jan 1, 2004
8.318
-1.296
-13.48%
jan 1, 2005
8.883
+0.565
6.79%
jan 1, 2006
7.925
-0.958
-10.78%
jan 1, 2007
6.25
-1.675
-21.14%
jan 1, 2008
6.01
-0.24
-3.85%
jan 1, 2009
5.289
-0.721
-12.0%
jan 1, 2010
7.65
+2.361
44.64%
jan 1, 2011
7.391
-0.259
-3.39%
jan 1, 2012
7.842
+0.451
6.1%
jan 1, 2013
7.212
-0.63
-8.03%
jan 1, 2014
6.572
-0.64
-8.87%
jan 1, 2015
8.602
+2.03
30.88%
Ranking of countries by current statistics by years


Comments: