29
/
en
AIzaSyAYiBZKx7MnpbEhh9jyipgxe19OcubqV5w
April 1, 2024
137102
Gambia, The
GMB
true
2
1
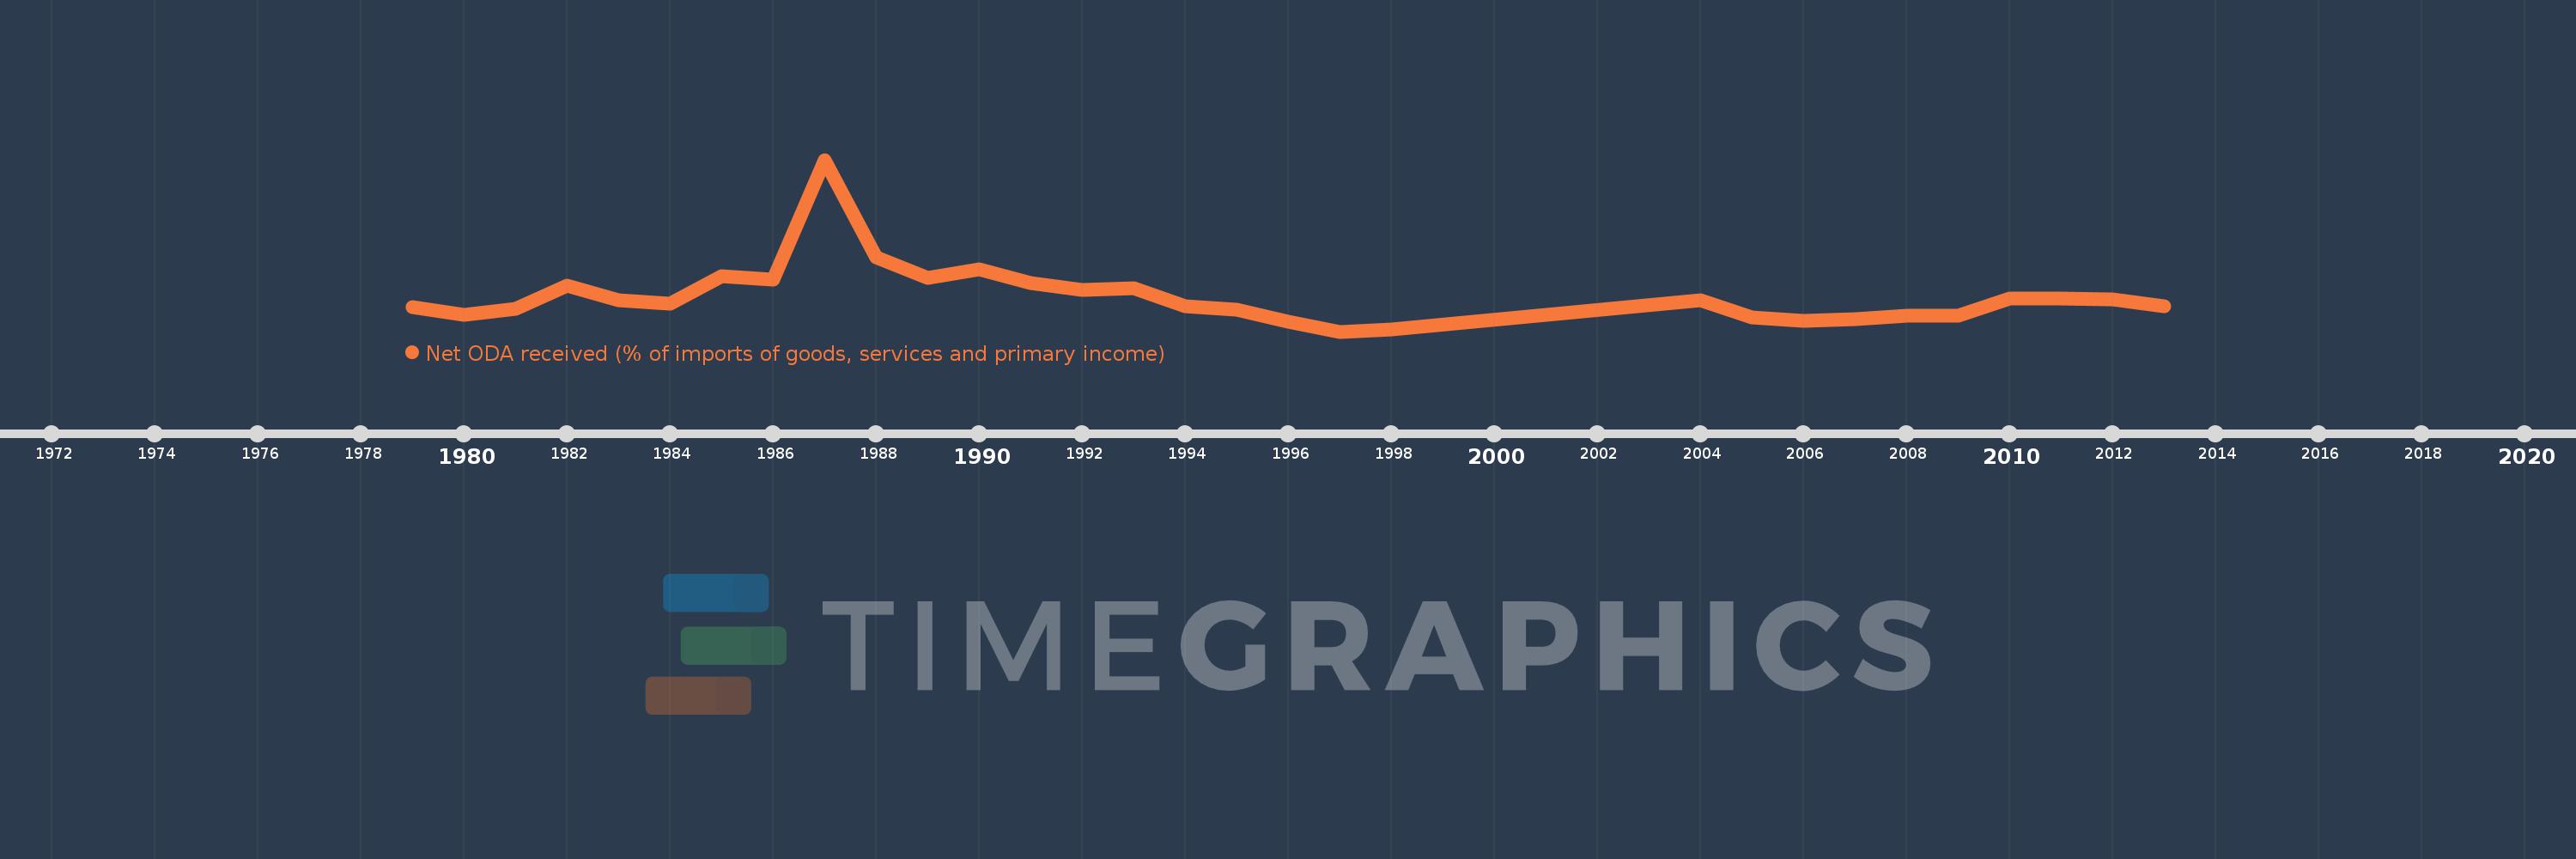
Net ODA received (% of imports of goods, services and primary income)
2013,2012,2011,2010,2009,2008,2007,2006,2005,2004,1998,1997,1996,1995,1994,1993,1992,1991,1990,1989,1988,1987,1986,1985,1984,1983,1982,1981,1980,1979
This statistics in other country:
AfghanistanAlbaniaAlgeriaAngolaAntigua and BarbudaArab WorldArgentinaArmeniaArubaAzerbaijanBahamas, TheBahrainBangladeshBarbadosBelarusBelizeBeninBhutanBoliviaBosnia and HerzegovinaBotswanaBrazilBurkina FasoBurundiCabo VerdeCambodiaCameroonCaribbean small statesCentral African RepublicCentral Europe and the BalticsChadChileChinaColombiaComorosCongo, Dem. Rep.Congo, Rep.Costa RicaCote d'IvoireCroatiaCyprusDjiboutiDominicaDominican RepublicEast Asia & PacificEast Asia & Pacific (excluding high income)East Asia & Pacific (IDA & IBRD countries)EcuadorEgypt, Arab Rep.El SalvadorEquatorial GuineaEritreaEthiopiaEuro areaEurope & Central AsiaEurope & Central Asia (excluding high income)Europe & Central Asia (IDA & IBRD countries)European UnionFijiFragile and conflict affected situationsGabonGambia, TheGeorgiaGhanaGrenadaGuatemalaGuineaGuinea-BissauGuyanaHaitiHeavily indebted poor countries (HIPC)High incomeHondurasIBRD onlyIDA & IBRD totalIDA blendIDA onlyIDA totalIndiaIndonesiaIran, Islamic Rep.IraqIsraelJamaicaJordanKazakhstanKenyaKiribatiKorea, Rep.KosovoKuwaitKyrgyz RepublicLao PDRLatin America & Caribbean Latin America & Caribbean (excluding high income)Latin America & the Caribbean (IDA & IBRD countries)Least developed countries: UN classificationLebanonLesothoLiberiaLibyaLow & middle incomeLow incomeLower middle incomeMacedonia, FYRMadagascarMalawiMalaysiaMaldivesMaliMaltaMarshall IslandsMauritaniaMauritiusMexicoMicronesia, Fed. Sts.Middle East & North Africa (excluding high income)Middle East & North Africa (IDA & IBRD countries)Middle incomeMoldovaMongoliaMontenegroMoroccoMozambiqueMyanmarNamibiaNepalNicaraguaNigerNigeriaNorth AmericaOECD membersOmanOther small statesPacific island small statesPakistanPalauPanamaPapua New GuineaParaguayPeruPhilippinesRwandaSamoaSao Tome and PrincipeSaudi ArabiaSenegalSerbiaSeychellesSierra LeoneSingaporeSloveniaSmall statesSolomon IslandsSouth AfricaSouth AsiaSouth Asia (IDA & IBRD)South SudanSri LankaSt. Kitts and NevisSt. LuciaSt. Vincent and the GrenadinesSub-Saharan Africa Sub-Saharan Africa (excluding high income)Sub-Saharan Africa (IDA & IBRD countries)SudanSurinameSwazilandSyrian Arab RepublicTajikistanTanzaniaThailandTimor-LesteTogoTongaTrinidad and TobagoTunisiaTurkeyTuvaluUgandaUkraineUpper middle incomeUruguayVanuatuVenezuela, RBVietnamWest Bank and GazaWorldYemen, Rep.ZambiaZimbabwe Timeline:
This timeline shows a graph from 1979 to 2013 of Gambia, The. No data until 1978. Number of actual observations by date: 30.
Source name:
World Development Indicators
Source organization:
Development Assistance Committee of the Organisation for Economic Co-operation and Development, Geographical Distribution of Financial Flows to Developing Countries, Development Co-operation Report, and International Development Statistics database. Data are available online at: www.oecd.org/dac/stats/idsonline. World Bank imports of good and services estimates are used for the denominator.
Categories, topics:
Aid Effectiveness
Last updated:
apr 23, 2017
Indicators value changes by year
Minimum:
12.041
jan 1, 1997
Maximum:
131.686
jan 1, 1987
At the date of observation
Value
Absolute change
Change from previous value
jan 1, 1979
29.086
+29.086
0.0%
jan 1, 1980
23.761
-5.325
-18.31%
jan 1, 1981
27.842
+4.081
17.18%
jan 1, 1982
44.197
+16.355
58.74%
jan 1, 1983
34.119
-10.078
-22.8%
jan 1, 1984
31.269
-2.85
-8.35%
jan 1, 1985
50.428
+19.159
61.27%
jan 1, 1986
48.359
-2.068
-4.1%
jan 1, 1987
131.686
+83.326
172.31%
jan 1, 1988
63.767
-67.919
-51.58%
jan 1, 1989
49.432
-14.334
-22.48%
jan 1, 1990
55.47
+6.037
12.21%
jan 1, 1991
45.889
-9.581
-17.27%
jan 1, 1992
40.768
-5.121
-11.16%
jan 1, 1993
42.054
+1.287
3.16%
jan 1, 1994
29.736
-12.318
-29.29%
jan 1, 1995
27.396
-2.34
-7.87%
jan 1, 1996
18.953
-8.443
-30.82%
jan 1, 1997
12.041
-6.911
-36.47%
jan 1, 1998
13.58
+1.539
12.78%
jan 1, 2004
33.6
+20.02
147.42%
jan 1, 2005
22.013
-11.588
-34.49%
jan 1, 2006
19.817
-2.196
-9.98%
jan 1, 2007
20.893
+1.077
5.43%
jan 1, 2008
23.152
+2.258
10.81%
jan 1, 2009
23.064
-0.088
-0.38%
jan 1, 2010
35.187
+12.123
52.56%
jan 1, 2011
35.147
-0.039
-0.11%
jan 1, 2012
34.252
-0.896
-2.55%
jan 1, 2013
29.672
-4.58
-13.37%
Ranking of countries by current statistics by years


Comments: