29
/
en
AIzaSyAYiBZKx7MnpbEhh9jyipgxe19OcubqV5w
April 1, 2024
144781
Guatemala
GTM
true
2
1
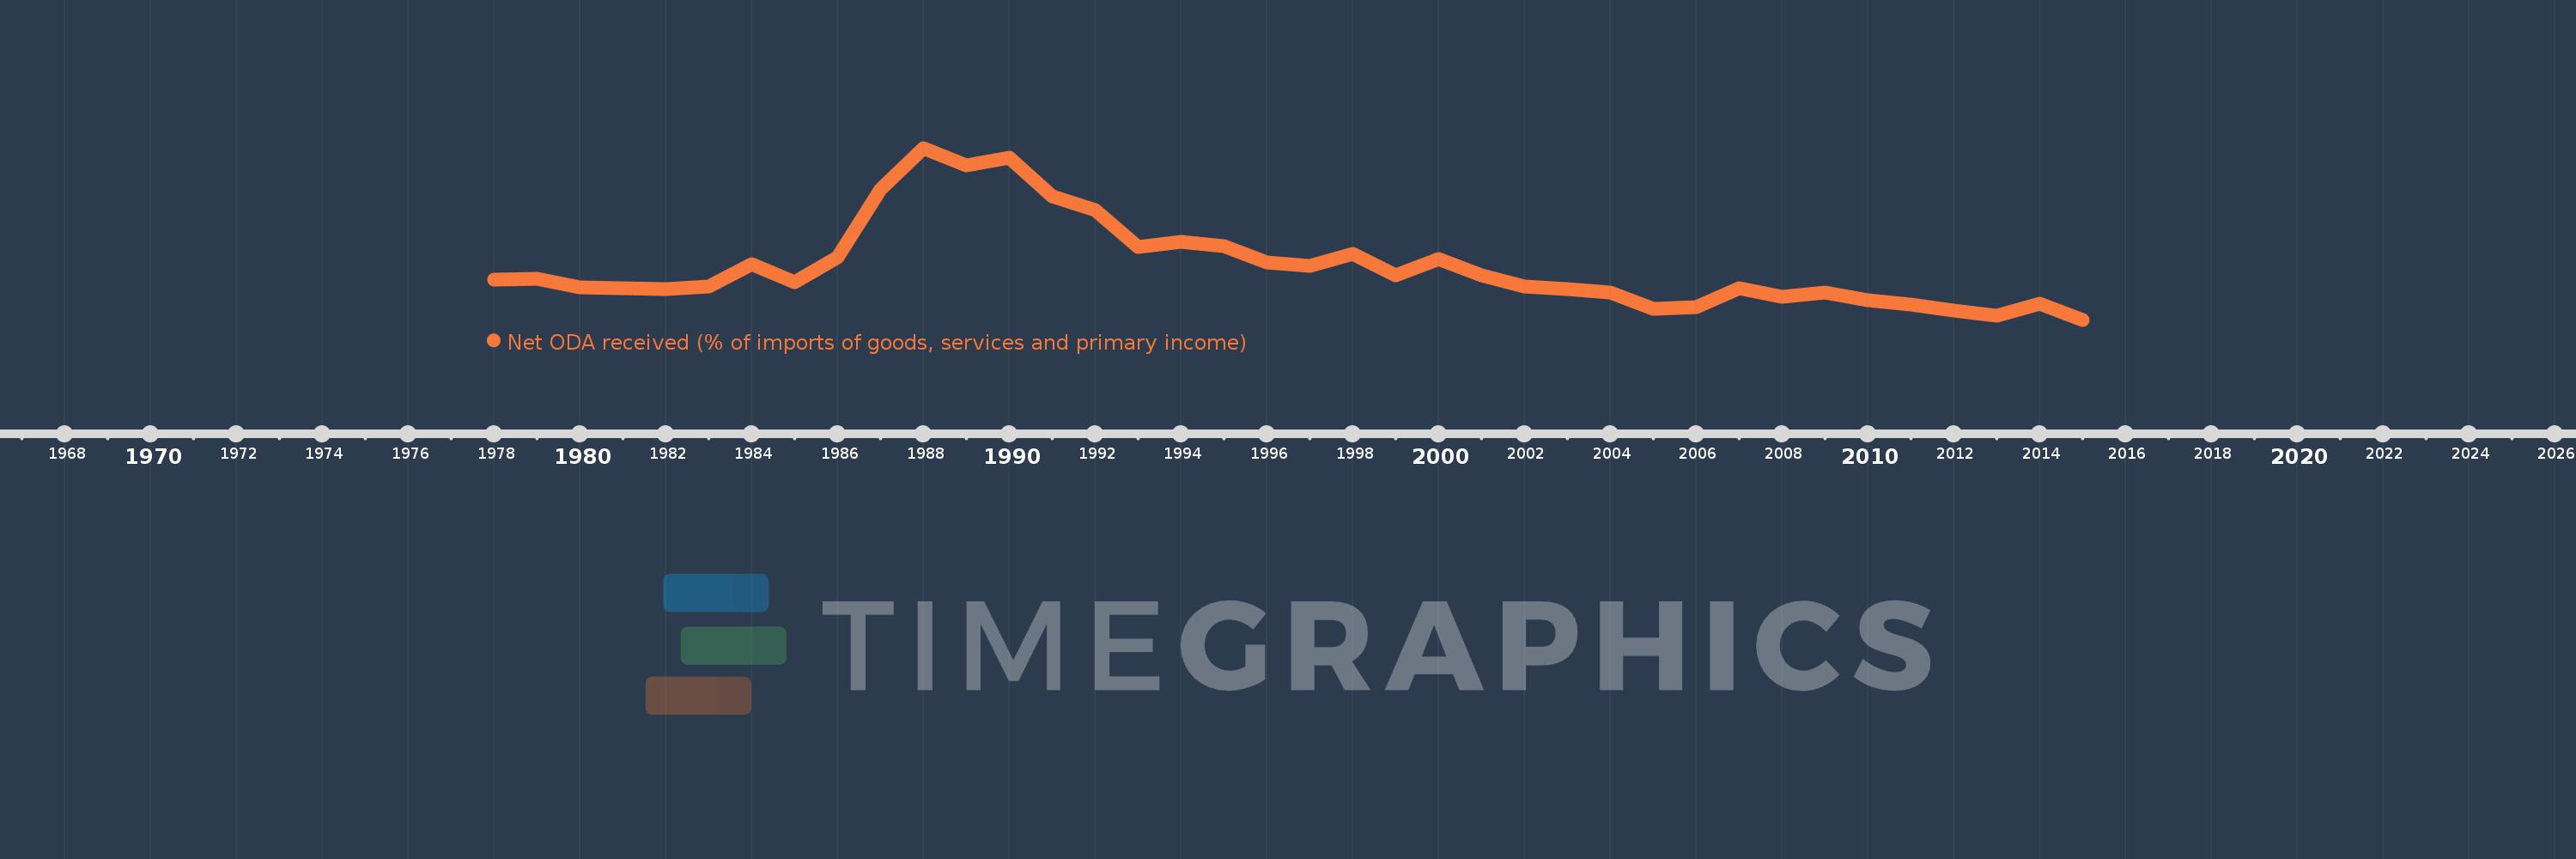
Net ODA received (% of imports of goods, services and primary income)
2015,2014,2013,2012,2011,2010,2009,2008,2007,2006,2005,2004,2003,2002,2001,2000,1999,1998,1997,1996,1995,1994,1993,1992,1991,1990,1989,1988,1987,1986,1985,1984,1983,1982,1981,1980,1979,1978
This statistics in other country:
AfghanistanAlbaniaAlgeriaAngolaAntigua and BarbudaArab WorldArgentinaArmeniaArubaAzerbaijanBahamas, TheBahrainBangladeshBarbadosBelarusBelizeBeninBhutanBoliviaBosnia and HerzegovinaBotswanaBrazilBurkina FasoBurundiCabo VerdeCambodiaCameroonCaribbean small statesCentral African RepublicCentral Europe and the BalticsChadChileChinaColombiaComorosCongo, Dem. Rep.Congo, Rep.Costa RicaCote d'IvoireCroatiaCyprusDjiboutiDominicaDominican RepublicEast Asia & PacificEast Asia & Pacific (excluding high income)East Asia & Pacific (IDA & IBRD countries)EcuadorEgypt, Arab Rep.El SalvadorEquatorial GuineaEritreaEthiopiaEuro areaEurope & Central AsiaEurope & Central Asia (excluding high income)Europe & Central Asia (IDA & IBRD countries)European UnionFijiFragile and conflict affected situationsGabonGambia, TheGeorgiaGhanaGrenadaGuatemalaGuineaGuinea-BissauGuyanaHaitiHeavily indebted poor countries (HIPC)High incomeHondurasIBRD onlyIDA & IBRD totalIDA blendIDA onlyIDA totalIndiaIndonesiaIran, Islamic Rep.IraqIsraelJamaicaJordanKazakhstanKenyaKiribatiKorea, Rep.KosovoKuwaitKyrgyz RepublicLao PDRLatin America & Caribbean Latin America & Caribbean (excluding high income)Latin America & the Caribbean (IDA & IBRD countries)Least developed countries: UN classificationLebanonLesothoLiberiaLibyaLow & middle incomeLow incomeLower middle incomeMacedonia, FYRMadagascarMalawiMalaysiaMaldivesMaliMaltaMarshall IslandsMauritaniaMauritiusMexicoMicronesia, Fed. Sts.Middle East & North Africa (excluding high income)Middle East & North Africa (IDA & IBRD countries)Middle incomeMoldovaMongoliaMontenegroMoroccoMozambiqueMyanmarNamibiaNepalNicaraguaNigerNigeriaNorth AmericaOECD membersOmanOther small statesPacific island small statesPakistanPalauPanamaPapua New GuineaParaguayPeruPhilippinesRwandaSamoaSao Tome and PrincipeSaudi ArabiaSenegalSerbiaSeychellesSierra LeoneSingaporeSloveniaSmall statesSolomon IslandsSouth AfricaSouth AsiaSouth Asia (IDA & IBRD)South SudanSri LankaSt. Kitts and NevisSt. LuciaSt. Vincent and the GrenadinesSub-Saharan Africa Sub-Saharan Africa (excluding high income)Sub-Saharan Africa (IDA & IBRD countries)SudanSurinameSwazilandSyrian Arab RepublicTajikistanTanzaniaThailandTimor-LesteTogoTongaTrinidad and TobagoTunisiaTurkeyTuvaluUgandaUkraineUpper middle incomeUruguayVanuatuVenezuela, RBVietnamWest Bank and GazaWorldYemen, Rep.ZambiaZimbabwe Timeline:
This timeline shows a graph from 1978 to 2015 of Guatemala. No data until 1977. Number of actual observations by date: 38.
Source name:
World Development Indicators
Source organization:
Development Assistance Committee of the Organisation for Economic Co-operation and Development, Geographical Distribution of Financial Flows to Developing Countries, Development Co-operation Report, and International Development Statistics database. Data are available online at: www.oecd.org/dac/stats/idsonline. World Bank imports of good and services estimates are used for the denominator.
Categories, topics:
Aid Effectiveness
Last updated:
apr 23, 2017
Indicators value changes by year
Maximum:
13.338
jan 1, 1988
At the date of observation
Value
Absolute change
Change from previous value
jan 1, 1979
4.108
+0.008
0.19%
jan 1, 1980
3.53
-0.577
-14.06%
jan 1, 1981
3.445
-0.085
-2.41%
jan 1, 1982
3.439
-0.007
-0.2%
jan 1, 1983
3.584
+0.145
4.23%
jan 1, 1984
5.183
+1.599
44.6%
jan 1, 1985
3.918
-1.265
-24.41%
jan 1, 1986
5.677
+1.759
44.9%
jan 1, 1987
10.397
+4.72
83.14%
jan 1, 1988
13.338
+2.941
28.29%
jan 1, 1989
12.126
-1.211
-9.08%
jan 1, 1990
12.662
+0.535
4.41%
jan 1, 1991
9.928
-2.734
-21.59%
jan 1, 1992
8.944
-0.984
-9.91%
jan 1, 1993
6.39
-2.555
-28.56%
jan 1, 1994
6.745
+0.355
5.55%
jan 1, 1995
6.446
-0.299
-4.43%
jan 1, 1996
5.299
-1.147
-17.8%
jan 1, 1997
5.048
-0.251
-4.73%
jan 1, 1998
5.87
+0.822
16.29%
jan 1, 1999
4.385
-1.485
-25.3%
jan 1, 2000
5.534
+1.149
26.2%
jan 1, 2001
4.392
-1.142
-20.63%
jan 1, 2002
3.621
-0.771
-17.56%
jan 1, 2003
3.401
-0.22
-6.07%
jan 1, 2004
3.164
-0.237
-6.97%
jan 1, 2005
2.027
-1.137
-35.94%
jan 1, 2006
2.159
+0.132
6.5%
jan 1, 2007
3.502
+1.344
62.24%
jan 1, 2008
2.856
-0.646
-18.46%
jan 1, 2009
3.174
+0.318
11.14%
jan 1, 2010
2.655
-0.519
-16.34%
jan 1, 2011
2.333
-0.322
-12.12%
jan 1, 2012
1.906
-0.428
-18.33%
jan 1, 2013
1.521
-0.385
-20.19%
jan 1, 2014
2.399
+0.878
57.75%
jan 1, 2015
1.256
-1.143
-47.64%
Ranking of countries by current statistics by years


Comments: