29
/
en
AIzaSyAYiBZKx7MnpbEhh9jyipgxe19OcubqV5w
April 1, 2024
126585
El Salvador
SLV
true
2
1
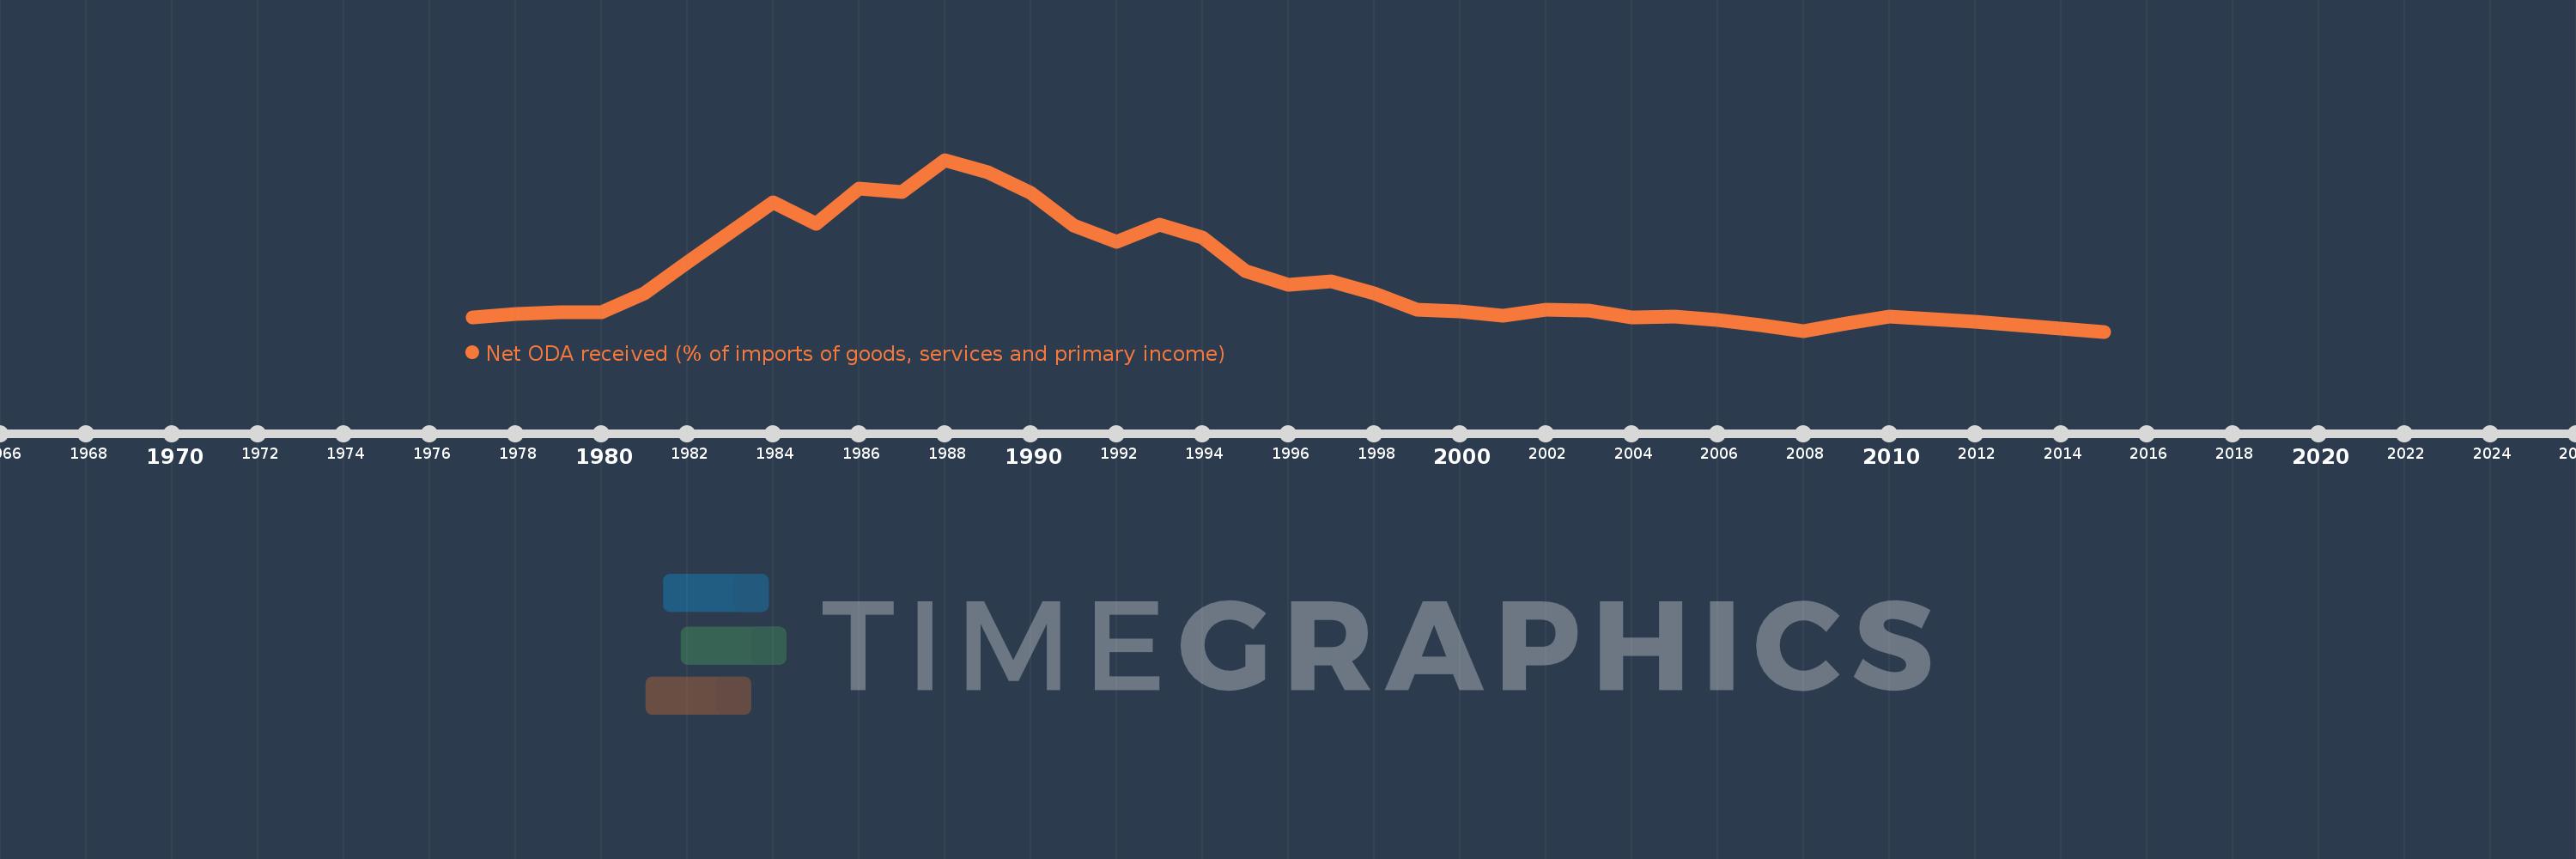
Net ODA received (% of imports of goods, services and primary income)
2015,2014,2013,2012,2011,2010,2009,2008,2007,2006,2005,2004,2003,2002,2001,2000,1999,1998,1997,1996,1995,1994,1993,1992,1991,1990,1989,1988,1987,1986,1985,1984,1983,1982,1981,1980,1979,1978,1977
This statistics in other country:
AfghanistanAlbaniaAlgeriaAngolaAntigua and BarbudaArab WorldArgentinaArmeniaArubaAzerbaijanBahamas, TheBahrainBangladeshBarbadosBelarusBelizeBeninBhutanBoliviaBosnia and HerzegovinaBotswanaBrazilBurkina FasoBurundiCabo VerdeCambodiaCameroonCaribbean small statesCentral African RepublicCentral Europe and the BalticsChadChileChinaColombiaComorosCongo, Dem. Rep.Congo, Rep.Costa RicaCote d'IvoireCroatiaCyprusDjiboutiDominicaDominican RepublicEast Asia & PacificEast Asia & Pacific (excluding high income)East Asia & Pacific (IDA & IBRD countries)EcuadorEgypt, Arab Rep.El SalvadorEquatorial GuineaEritreaEthiopiaEuro areaEurope & Central AsiaEurope & Central Asia (excluding high income)Europe & Central Asia (IDA & IBRD countries)European UnionFijiFragile and conflict affected situationsGabonGambia, TheGeorgiaGhanaGrenadaGuatemalaGuineaGuinea-BissauGuyanaHaitiHeavily indebted poor countries (HIPC)High incomeHondurasIBRD onlyIDA & IBRD totalIDA blendIDA onlyIDA totalIndiaIndonesiaIran, Islamic Rep.IraqIsraelJamaicaJordanKazakhstanKenyaKiribatiKorea, Rep.KosovoKuwaitKyrgyz RepublicLao PDRLatin America & Caribbean Latin America & Caribbean (excluding high income)Latin America & the Caribbean (IDA & IBRD countries)Least developed countries: UN classificationLebanonLesothoLiberiaLibyaLow & middle incomeLow incomeLower middle incomeMacedonia, FYRMadagascarMalawiMalaysiaMaldivesMaliMaltaMarshall IslandsMauritaniaMauritiusMexicoMicronesia, Fed. Sts.Middle East & North Africa (excluding high income)Middle East & North Africa (IDA & IBRD countries)Middle incomeMoldovaMongoliaMontenegroMoroccoMozambiqueMyanmarNamibiaNepalNicaraguaNigerNigeriaNorth AmericaOECD membersOmanOther small statesPacific island small statesPakistanPalauPanamaPapua New GuineaParaguayPeruPhilippinesRwandaSamoaSao Tome and PrincipeSaudi ArabiaSenegalSerbiaSeychellesSierra LeoneSingaporeSloveniaSmall statesSolomon IslandsSouth AfricaSouth AsiaSouth Asia (IDA & IBRD)South SudanSri LankaSt. Kitts and NevisSt. LuciaSt. Vincent and the GrenadinesSub-Saharan Africa Sub-Saharan Africa (excluding high income)Sub-Saharan Africa (IDA & IBRD countries)SudanSurinameSwazilandSyrian Arab RepublicTajikistanTanzaniaThailandTimor-LesteTogoTongaTrinidad and TobagoTunisiaTurkeyTuvaluUgandaUkraineUpper middle incomeUruguayVanuatuVenezuela, RBVietnamWest Bank and GazaWorldYemen, Rep.ZambiaZimbabwe Timeline:
This timeline shows a graph from 1977 to 2015 of El Salvador. No data until 1976. Number of actual observations by date: 39.
Source name:
World Development Indicators
Source organization:
Development Assistance Committee of the Organisation for Economic Co-operation and Development, Geographical Distribution of Financial Flows to Developing Countries, Development Co-operation Report, and International Development Statistics database. Data are available online at: www.oecd.org/dac/stats/idsonline. World Bank imports of good and services estimates are used for the denominator.
Categories, topics:
Aid Effectiveness
Last updated:
apr 23, 2017
Indicators value changes by year
Maximum:
31.094
jan 1, 1988
At the date of observation
Value
Absolute change
Change from previous value
jan 1, 1977
3.283
+3.283
0.0%
jan 1, 1978
3.972
+0.689
20.99%
jan 1, 1979
4.251
+0.279
7.03%
jan 1, 1980
4.285
+0.034
0.8%
jan 1, 1981
7.475
+3.19
74.44%
jan 1, 1982
13.051
+5.576
74.6%
jan 1, 1983
18.286
+5.234
40.11%
jan 1, 1984
23.594
+5.308
29.03%
jan 1, 1985
19.845
-3.749
-15.89%
jan 1, 1986
26.067
+6.222
31.35%
jan 1, 1987
25.42
-0.647
-2.48%
jan 1, 1988
31.094
+5.674
22.32%
jan 1, 1989
28.879
-2.215
-7.12%
jan 1, 1990
25.311
-3.568
-12.35%
jan 1, 1991
19.453
-5.858
-23.14%
jan 1, 1992
16.706
-2.747
-14.12%
jan 1, 1993
19.654
+2.948
17.65%
jan 1, 1994
17.344
-2.31
-11.75%
jan 1, 1995
11.477
-5.867
-33.83%
jan 1, 1996
9.047
-2.429
-21.17%
jan 1, 1997
9.647
+0.6
6.63%
jan 1, 1998
7.563
-2.084
-21.6%
jan 1, 1999
4.604
-2.959
-39.13%
jan 1, 2000
4.408
-0.196
-4.26%
jan 1, 2001
3.683
-0.725
-16.44%
jan 1, 2002
4.701
+1.018
27.64%
jan 1, 2003
4.567
-0.134
-2.85%
jan 1, 2004
3.384
-1.184
-25.91%
jan 1, 2005
3.506
+0.122
3.6%
jan 1, 2006
2.85
-0.655
-18.69%
jan 1, 2007
1.977
-0.874
-30.66%
jan 1, 2008
0.916
-1.061
-53.68%
jan 1, 2009
2.273
+1.357
148.23%
jan 1, 2010
3.429
+1.157
50.9%
jan 1, 2011
3.051
-0.379
-11.04%
jan 1, 2012
2.552
-0.498
-16.33%
jan 1, 2013
1.924
-0.629
-24.64%
jan 1, 2014
1.391
-0.533
-27.71%
jan 1, 2015
0.81
-0.581
-41.77%
Ranking of countries by current statistics by years


Comments: