29
/
en
AIzaSyAYiBZKx7MnpbEhh9jyipgxe19OcubqV5w
April 1, 2024
213354
Nigeria
NGA
true
2
1
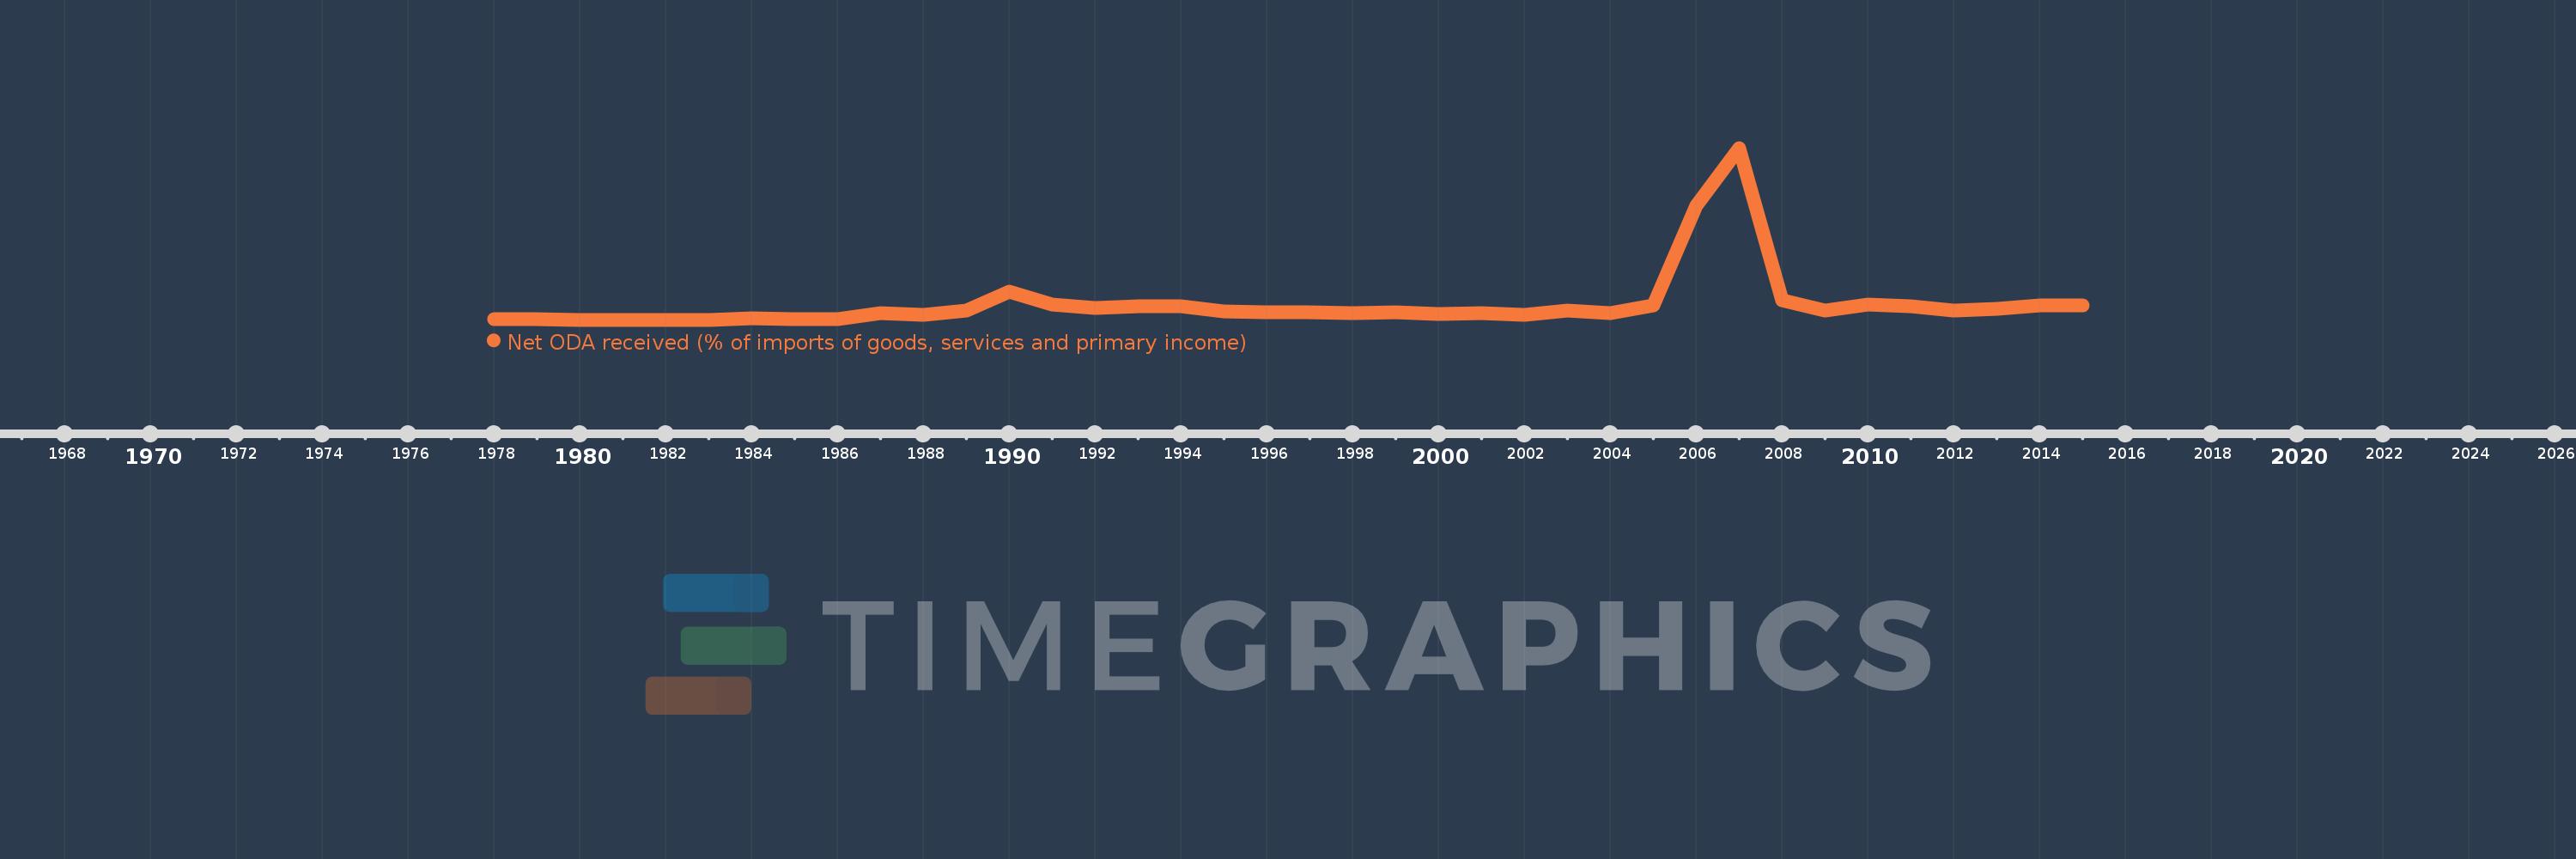
Net ODA received (% of imports of goods, services and primary income)
2015,2014,2013,2012,2011,2010,2009,2008,2007,2006,2005,2004,2003,2002,2001,2000,1999,1998,1997,1996,1995,1994,1993,1992,1991,1990,1989,1988,1987,1986,1985,1984,1983,1982,1981,1980,1979,1978
This statistics in other country:
AfghanistanAlbaniaAlgeriaAngolaAntigua and BarbudaArab WorldArgentinaArmeniaArubaAzerbaijanBahamas, TheBahrainBangladeshBarbadosBelarusBelizeBeninBhutanBoliviaBosnia and HerzegovinaBotswanaBrazilBurkina FasoBurundiCabo VerdeCambodiaCameroonCaribbean small statesCentral African RepublicCentral Europe and the BalticsChadChileChinaColombiaComorosCongo, Dem. Rep.Congo, Rep.Costa RicaCote d'IvoireCroatiaCyprusDjiboutiDominicaDominican RepublicEast Asia & PacificEast Asia & Pacific (excluding high income)East Asia & Pacific (IDA & IBRD countries)EcuadorEgypt, Arab Rep.El SalvadorEquatorial GuineaEritreaEthiopiaEuro areaEurope & Central AsiaEurope & Central Asia (excluding high income)Europe & Central Asia (IDA & IBRD countries)European UnionFijiFragile and conflict affected situationsGabonGambia, TheGeorgiaGhanaGrenadaGuatemalaGuineaGuinea-BissauGuyanaHaitiHeavily indebted poor countries (HIPC)High incomeHondurasIBRD onlyIDA & IBRD totalIDA blendIDA onlyIDA totalIndiaIndonesiaIran, Islamic Rep.IraqIsraelJamaicaJordanKazakhstanKenyaKiribatiKorea, Rep.KosovoKuwaitKyrgyz RepublicLao PDRLatin America & Caribbean Latin America & Caribbean (excluding high income)Latin America & the Caribbean (IDA & IBRD countries)Least developed countries: UN classificationLebanonLesothoLiberiaLibyaLow & middle incomeLow incomeLower middle incomeMacedonia, FYRMadagascarMalawiMalaysiaMaldivesMaliMaltaMarshall IslandsMauritaniaMauritiusMexicoMicronesia, Fed. Sts.Middle East & North Africa (excluding high income)Middle East & North Africa (IDA & IBRD countries)Middle incomeMoldovaMongoliaMontenegroMoroccoMozambiqueMyanmarNamibiaNepalNicaraguaNigerNigeriaNorth AmericaOECD membersOmanOther small statesPacific island small statesPakistanPalauPanamaPapua New GuineaParaguayPeruPhilippinesRwandaSamoaSao Tome and PrincipeSaudi ArabiaSenegalSerbiaSeychellesSierra LeoneSingaporeSloveniaSmall statesSolomon IslandsSouth AfricaSouth AsiaSouth Asia (IDA & IBRD)South SudanSri LankaSt. Kitts and NevisSt. LuciaSt. Vincent and the GrenadinesSub-Saharan Africa Sub-Saharan Africa (excluding high income)Sub-Saharan Africa (IDA & IBRD countries)SudanSurinameSwazilandSyrian Arab RepublicTajikistanTanzaniaThailandTimor-LesteTogoTongaTrinidad and TobagoTunisiaTurkeyTuvaluUgandaUkraineUpper middle incomeUruguayVanuatuVenezuela, RBVietnamWest Bank and GazaWorldYemen, Rep.ZambiaZimbabwe Timeline:
This timeline shows a graph from 1978 to 2015 of Nigeria. No data until 1977. Number of actual observations by date: 38.
Source name:
World Development Indicators
Source organization:
Development Assistance Committee of the Organisation for Economic Co-operation and Development, Geographical Distribution of Financial Flows to Developing Countries, Development Co-operation Report, and International Development Statistics database. Data are available online at: www.oecd.org/dac/stats/idsonline. World Bank imports of good and services estimates are used for the denominator.
Categories, topics:
Aid Effectiveness
Last updated:
apr 23, 2017
Indicators value changes by year
At the date of observation
Value
Absolute change
Change from previous value
jan 1, 1978
0.298
+0.298
0.0%
jan 1, 1979
0.266
-0.032
-10.59%
jan 1, 1980
0.161
-0.105
-39.39%
jan 1, 1981
0.156
-0.005
-3.04%
jan 1, 1982
0.155
-0.002
-1.09%
jan 1, 1983
0.177
+0.022
14.53%
jan 1, 1984
0.316
+0.139
78.34%
jan 1, 1985
0.272
-0.043
-13.76%
jan 1, 1986
0.298
+0.025
9.35%
jan 1, 1987
1.152
+0.855
286.96%
jan 1, 1988
0.858
-0.294
-25.53%
jan 1, 1989
1.561
+0.703
81.9%
jan 1, 1990
4.519
+2.958
189.48%
jan 1, 1991
2.588
-1.931
-42.74%
jan 1, 1992
2.004
-0.584
-22.57%
jan 1, 1993
2.254
+0.25
12.48%
jan 1, 1994
2.267
+0.013
0.59%
jan 1, 1995
1.517
-0.75
-33.09%
jan 1, 1996
1.334
-0.183
-12.08%
jan 1, 1997
1.311
-0.023
-1.72%
jan 1, 1998
1.134
-0.177
-13.48%
jan 1, 1999
1.27
+0.136
11.97%
jan 1, 2000
1.02
-0.25
-19.66%
jan 1, 2001
1.129
+0.109
10.7%
jan 1, 2002
0.94
-0.189
-16.72%
jan 1, 2003
1.597
+0.657
69.86%
jan 1, 2004
1.224
-0.374
-23.41%
jan 1, 2005
2.437
+1.214
99.21%
jan 1, 2006
17.915
+15.478
635.05%
jan 1, 2007
26.96
+9.045
50.49%
jan 1, 2008
3.21
-23.75
-88.09%
jan 1, 2009
1.58
-1.629
-50.76%
jan 1, 2010
2.557
+0.976
61.76%
jan 1, 2011
2.254
-0.302
-11.83%
jan 1, 2012
1.542
-0.713
-31.61%
jan 1, 2013
1.84
+0.298
19.34%
jan 1, 2014
2.441
+0.601
32.67%
jan 1, 2015
2.328
-0.113
-4.62%
Ranking of countries by current statistics by years


Comments: