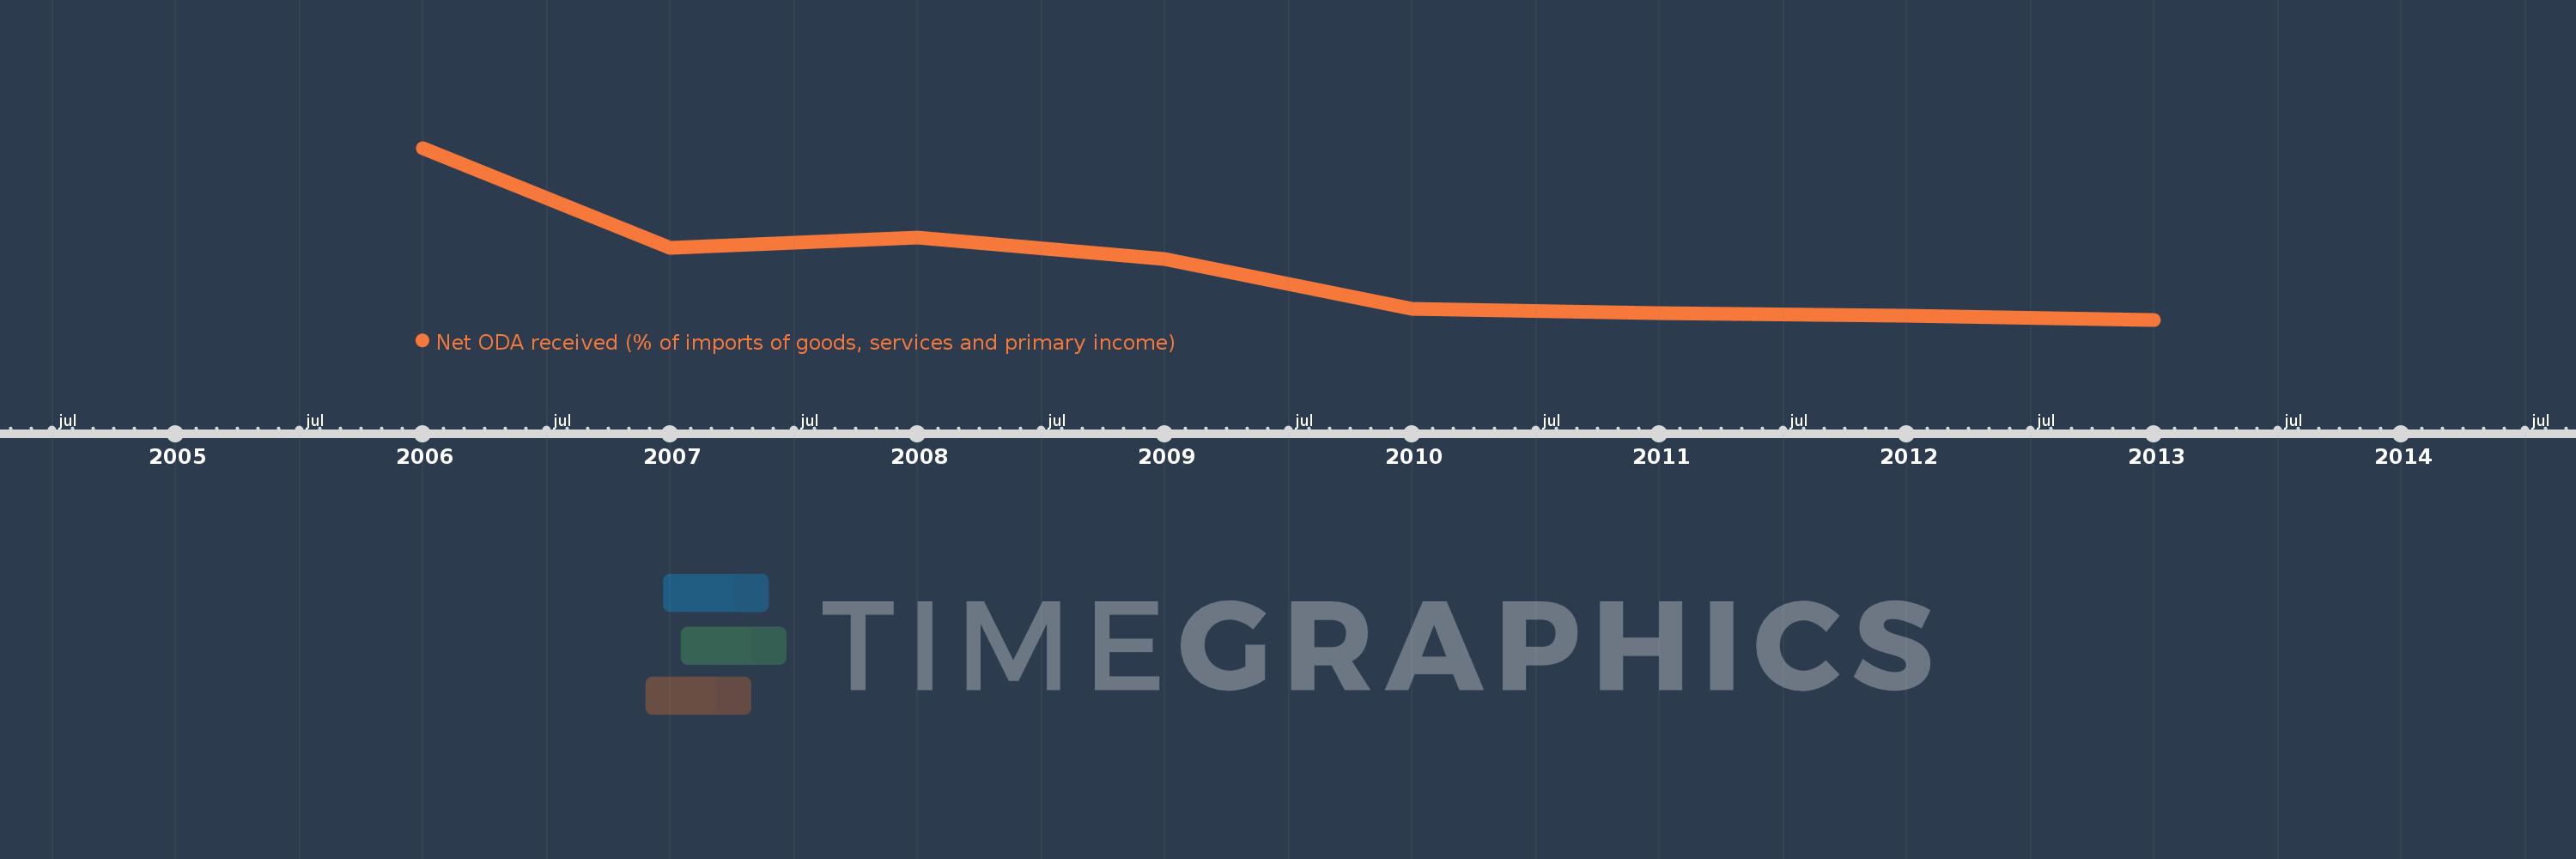
This timeline shows a graph from 2006 to 2013 of Iraq. No data until 2005. Number of actual observations by date: 8.
Source name:
World Development Indicators
Source organization:
Development Assistance Committee of the Organisation for Economic Co-operation and Development, Geographical Distribution of Financial Flows to Developing Countries, Development Co-operation Report, and International Development Statistics database. Data are available online at: www.oecd.org/dac/stats/idsonline. World Bank imports of good and services estimates are used for the denominator.
Categories, topics:
Aid Effectiveness
Last updated:
apr 23, 2017
Indicators value changes by year
Meaning:
22.316
Minimum:
2.018
jan 1, 2013
Maximum:
70.461
jan 1, 2006
At the date of observation
Value
Absolute change
Change from the previous value
jan 1, 2006
70.461
+70.461
0.0%
jan 1, 2007
30.707
-39.753
-56.42%
jan 1, 2008
34.762
+4.054
13.2%
jan 1, 2009
26.09
-8.672
-24.95%
jan 1, 2010
6.32
-19.77
-75.78%
jan 1, 2011
4.569
-1.751
-27.71%
jan 1, 2012
3.601
-0.967
-21.18%
jan 1, 2013
2.018
-1.584
-43.97%
Ranking of countries by current statistics by years
