29
/
en
AIzaSyAYiBZKx7MnpbEhh9jyipgxe19OcubqV5w
April 1, 2024
249129
Sri Lanka
LKA
true
2
1
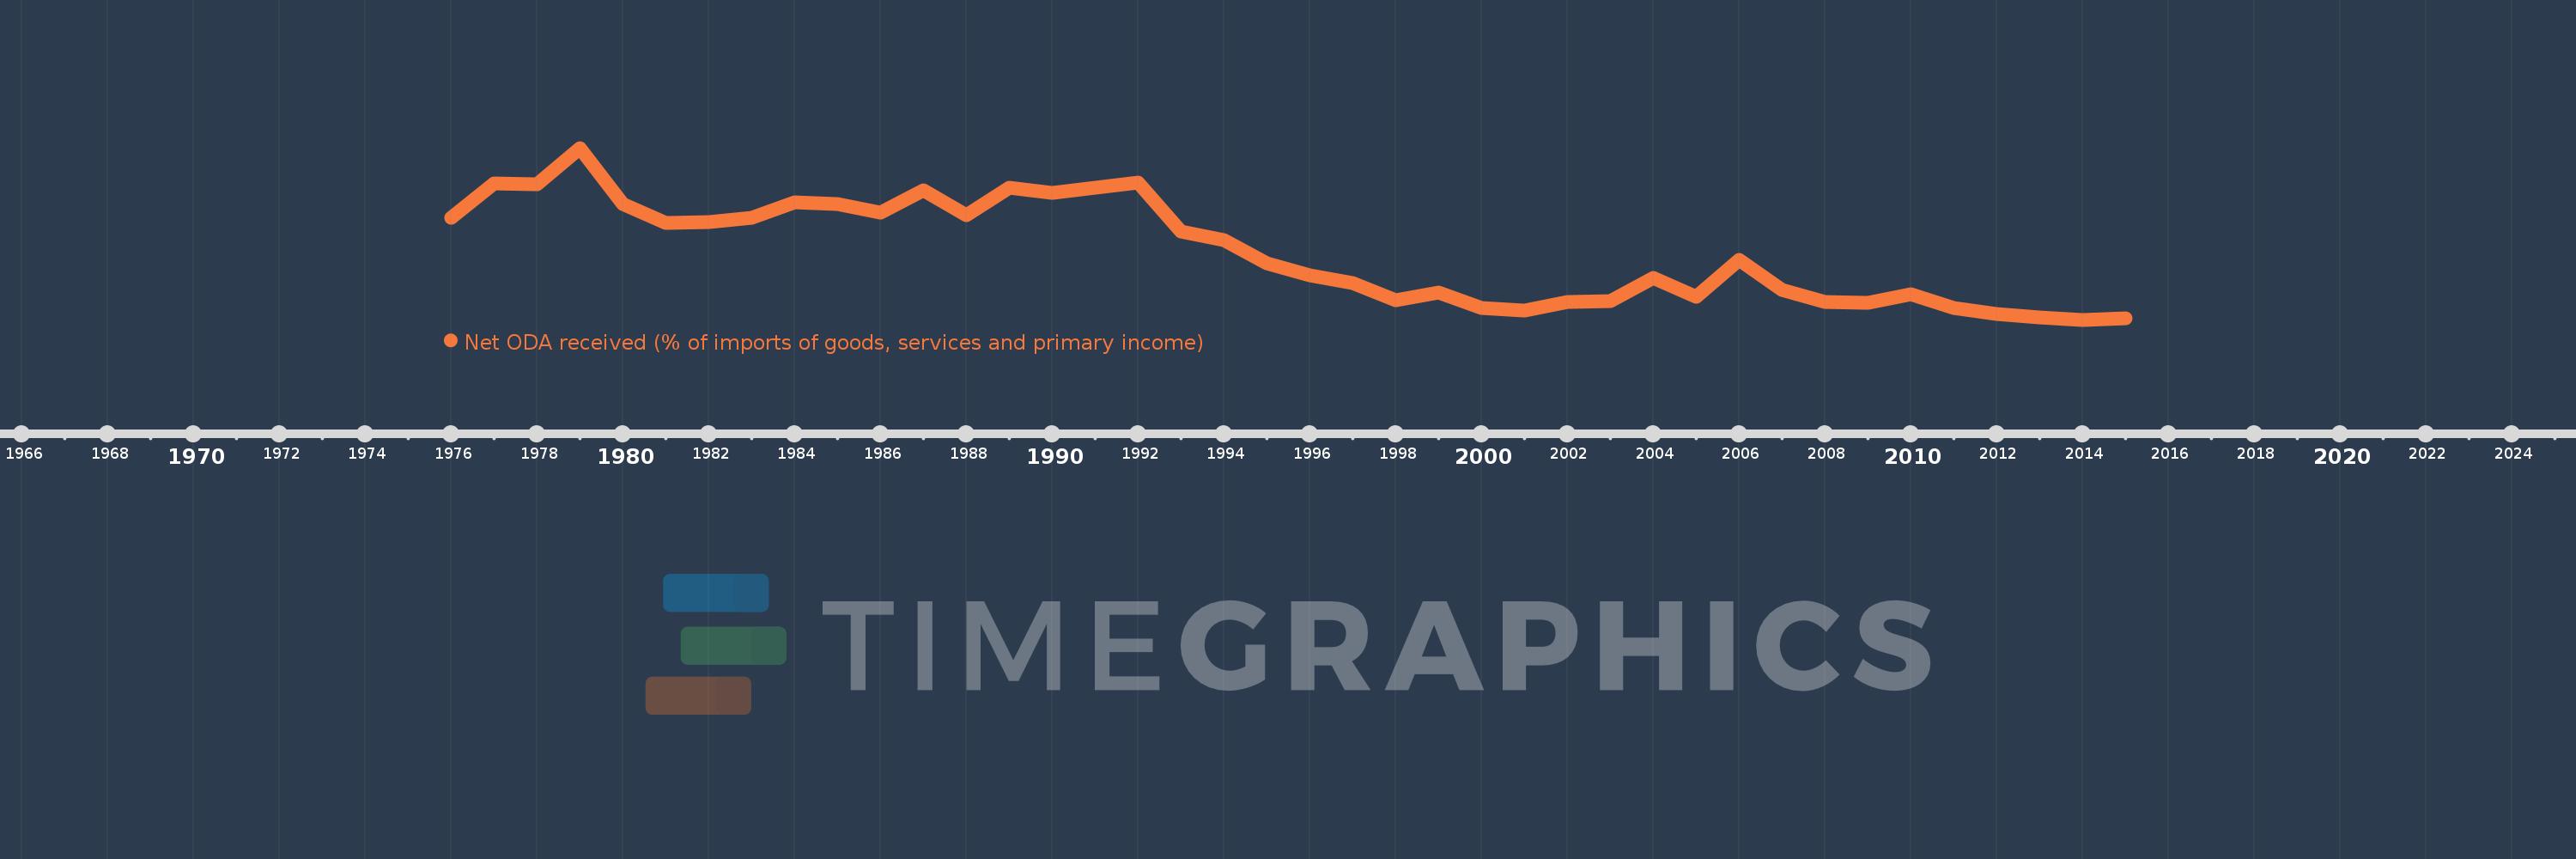
Net ODA received (% of imports of goods, services and primary income)
2015,2014,2013,2012,2011,2010,2009,2008,2007,2006,2005,2004,2003,2002,2001,2000,1999,1998,1997,1996,1995,1994,1993,1992,1991,1990,1989,1988,1987,1986,1985,1984,1983,1982,1981,1980,1979,1978,1977,1976
This statistics in other country:
AfghanistanAlbaniaAlgeriaAngolaAntigua and BarbudaArab WorldArgentinaArmeniaArubaAzerbaijanBahamas, TheBahrainBangladeshBarbadosBelarusBelizeBeninBhutanBoliviaBosnia and HerzegovinaBotswanaBrazilBurkina FasoBurundiCabo VerdeCambodiaCameroonCaribbean small statesCentral African RepublicCentral Europe and the BalticsChadChileChinaColombiaComorosCongo, Dem. Rep.Congo, Rep.Costa RicaCote d'IvoireCroatiaCyprusDjiboutiDominicaDominican RepublicEast Asia & PacificEast Asia & Pacific (excluding high income)East Asia & Pacific (IDA & IBRD countries)EcuadorEgypt, Arab Rep.El SalvadorEquatorial GuineaEritreaEthiopiaEuro areaEurope & Central AsiaEurope & Central Asia (excluding high income)Europe & Central Asia (IDA & IBRD countries)European UnionFijiFragile and conflict affected situationsGabonGambia, TheGeorgiaGhanaGrenadaGuatemalaGuineaGuinea-BissauGuyanaHaitiHeavily indebted poor countries (HIPC)High incomeHondurasIBRD onlyIDA & IBRD totalIDA blendIDA onlyIDA totalIndiaIndonesiaIran, Islamic Rep.IraqIsraelJamaicaJordanKazakhstanKenyaKiribatiKorea, Rep.KosovoKuwaitKyrgyz RepublicLao PDRLatin America & Caribbean Latin America & Caribbean (excluding high income)Latin America & the Caribbean (IDA & IBRD countries)Least developed countries: UN classificationLebanonLesothoLiberiaLibyaLow & middle incomeLow incomeLower middle incomeMacedonia, FYRMadagascarMalawiMalaysiaMaldivesMaliMaltaMarshall IslandsMauritaniaMauritiusMexicoMicronesia, Fed. Sts.Middle East & North Africa (excluding high income)Middle East & North Africa (IDA & IBRD countries)Middle incomeMoldovaMongoliaMontenegroMoroccoMozambiqueMyanmarNamibiaNepalNicaraguaNigerNigeriaNorth AmericaOECD membersOmanOther small statesPacific island small statesPakistanPalauPanamaPapua New GuineaParaguayPeruPhilippinesRwandaSamoaSao Tome and PrincipeSaudi ArabiaSenegalSerbiaSeychellesSierra LeoneSingaporeSloveniaSmall statesSolomon IslandsSouth AfricaSouth AsiaSouth Asia (IDA & IBRD)South SudanSri LankaSt. Kitts and NevisSt. LuciaSt. Vincent and the GrenadinesSub-Saharan Africa Sub-Saharan Africa (excluding high income)Sub-Saharan Africa (IDA & IBRD countries)SudanSurinameSwazilandSyrian Arab RepublicTajikistanTanzaniaThailandTimor-LesteTogoTongaTrinidad and TobagoTunisiaTurkeyTuvaluUgandaUkraineUpper middle incomeUruguayVanuatuVenezuela, RBVietnamWest Bank and GazaWorldYemen, Rep.ZambiaZimbabwe Timeline:
This timeline shows a graph from 1976 to 2015 of Sri Lanka. No data until 1975. Number of actual observations by date: 40.
Source name:
World Development Indicators
Source organization:
Development Assistance Committee of the Organisation for Economic Co-operation and Development, Geographical Distribution of Financial Flows to Developing Countries, Development Co-operation Report, and International Development Statistics database. Data are available online at: www.oecd.org/dac/stats/idsonline. World Bank imports of good and services estimates are used for the denominator.
Categories, topics:
Aid Effectiveness
Last updated:
apr 23, 2017
Indicators value changes by year
Maximum:
28.859
jan 1, 1979
At the date of observation
Value
Absolute change
Change from previous value
jan 1, 1976
17.79
+17.79
0.0%
jan 1, 1977
23.28
+5.49
30.86%
jan 1, 1978
23.143
-0.137
-0.59%
jan 1, 1979
28.859
+5.716
24.7%
jan 1, 1980
20.029
-8.83
-30.6%
jan 1, 1981
17.05
-2.98
-14.88%
jan 1, 1982
17.176
+0.126
0.74%
jan 1, 1983
17.832
+0.656
3.82%
jan 1, 1984
20.266
+2.434
13.65%
jan 1, 1985
19.989
-0.277
-1.37%
jan 1, 1986
18.688
-1.302
-6.51%
jan 1, 1987
22.136
+3.449
18.45%
jan 1, 1988
18.239
-3.897
-17.61%
jan 1, 1989
22.578
+4.339
23.79%
jan 1, 1990
21.737
-0.841
-3.73%
jan 1, 1991
22.588
+0.851
3.91%
jan 1, 1992
23.378
+0.791
3.5%
jan 1, 1993
15.655
-7.724
-33.04%
jan 1, 1994
14.322
-1.332
-8.51%
jan 1, 1995
10.62
-3.702
-25.85%
jan 1, 1996
8.732
-1.888
-17.78%
jan 1, 1997
7.508
-1.224
-14.02%
jan 1, 1998
4.743
-2.764
-36.82%
jan 1, 1999
6.002
+1.258
26.53%
jan 1, 2000
3.639
-2.362
-39.36%
jan 1, 2001
3.217
-0.422
-11.59%
jan 1, 2002
4.551
+1.333
41.44%
jan 1, 2003
4.633
+0.083
1.82%
jan 1, 2004
8.371
+3.737
80.66%
jan 1, 2005
5.348
-3.022
-36.1%
jan 1, 2006
11.121
+5.773
107.94%
jan 1, 2007
6.383
-4.739
-42.61%
jan 1, 2008
4.529
-1.854
-29.05%
jan 1, 2009
4.33
-0.199
-4.4%
jan 1, 2010
5.703
+1.374
31.73%
jan 1, 2011
3.606
-2.097
-36.78%
jan 1, 2012
2.61
-0.996
-27.63%
jan 1, 2013
2.114
-0.496
-19.01%
jan 1, 2014
1.715
-0.399
-18.87%
jan 1, 2015
1.945
+0.23
13.39%
Ranking of countries by current statistics by years


Comments: