29
/
en
AIzaSyAYiBZKx7MnpbEhh9jyipgxe19OcubqV5w
April 1, 2024
269738
Turkey
TUR
true
2
1
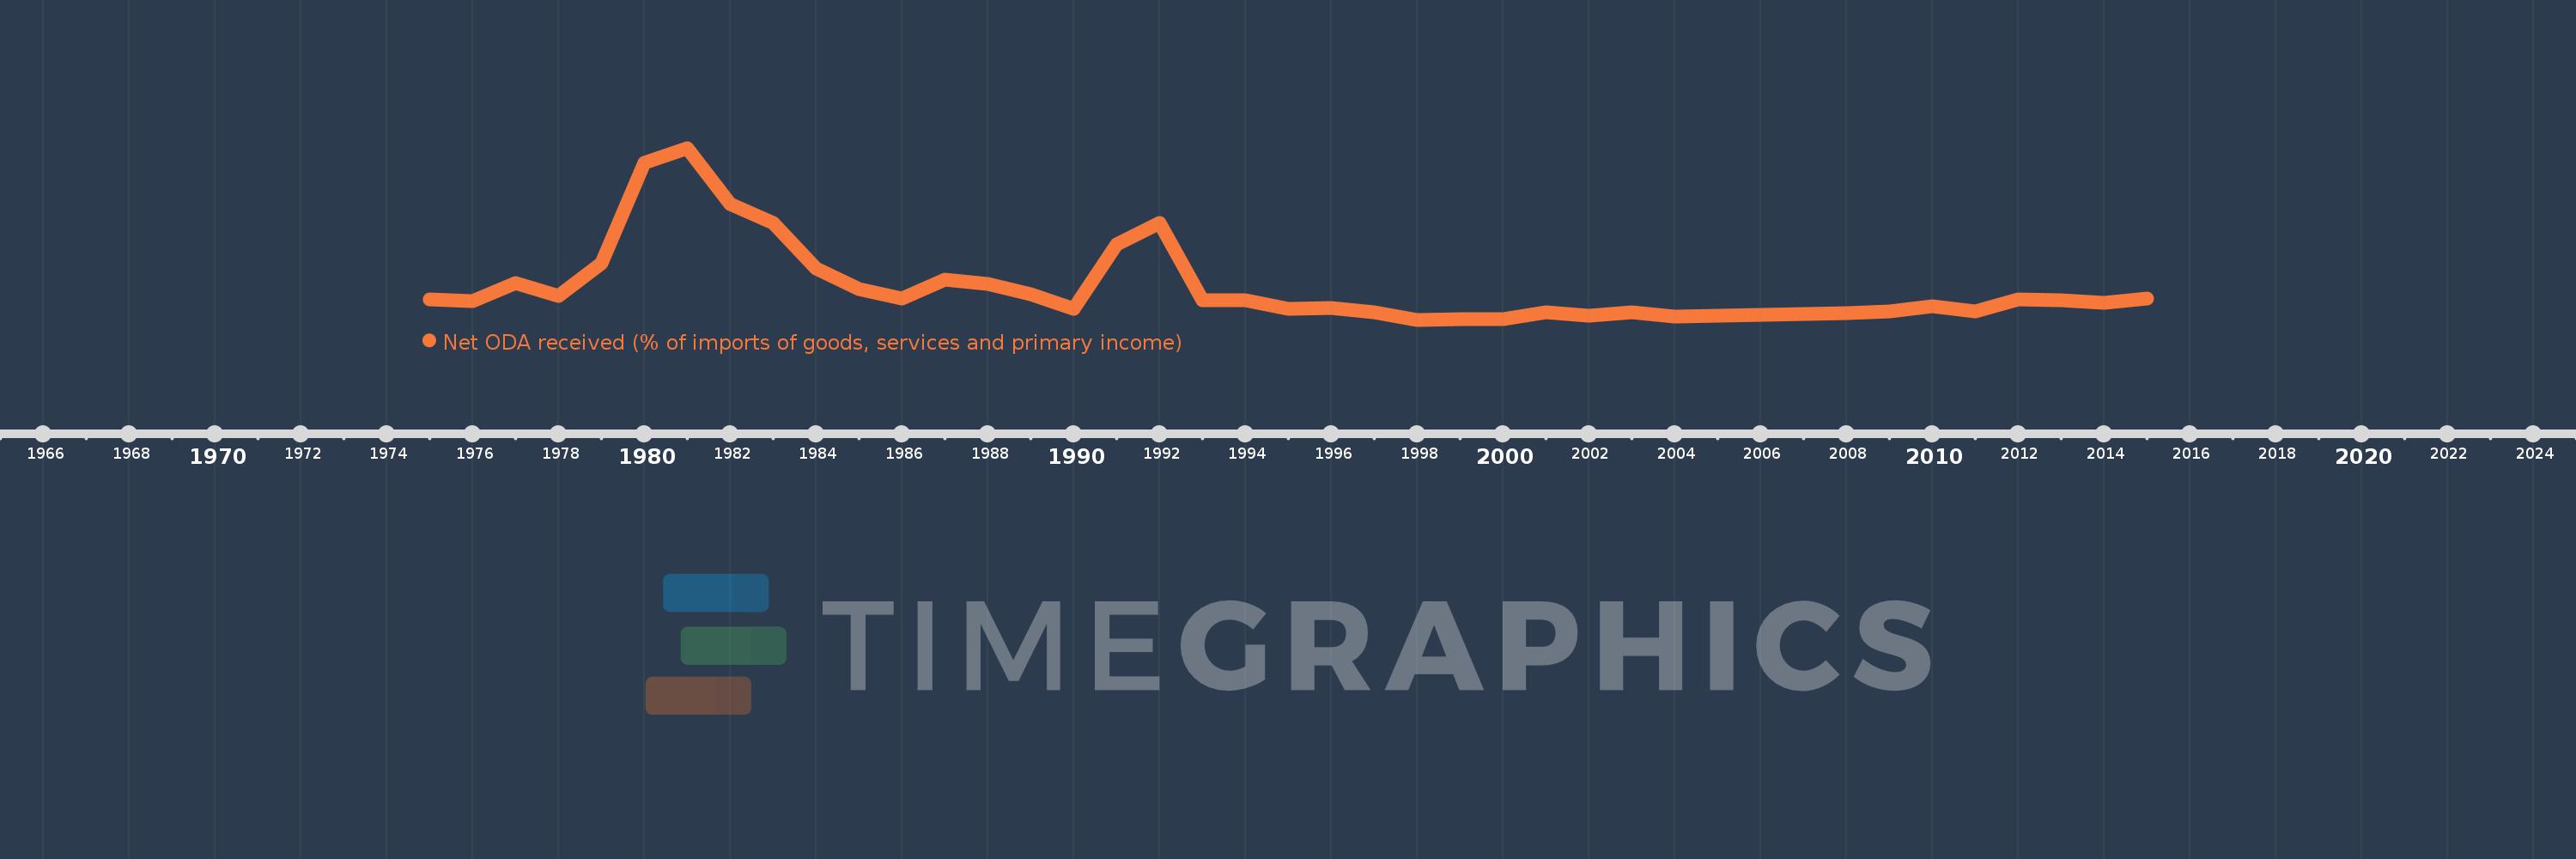
Net ODA received (% of imports of goods, services and primary income)
2015,2014,2013,2012,2011,2010,2009,2008,2007,2006,2005,2004,2003,2002,2001,2000,1999,1998,1997,1996,1995,1994,1993,1992,1991,1990,1989,1988,1987,1986,1985,1984,1983,1982,1981,1980,1979,1978,1977,1976,1975
This statistics in other country:
AfghanistanAlbaniaAlgeriaAngolaAntigua and BarbudaArab WorldArgentinaArmeniaArubaAzerbaijanBahamas, TheBahrainBangladeshBarbadosBelarusBelizeBeninBhutanBoliviaBosnia and HerzegovinaBotswanaBrazilBurkina FasoBurundiCabo VerdeCambodiaCameroonCaribbean small statesCentral African RepublicCentral Europe and the BalticsChadChileChinaColombiaComorosCongo, Dem. Rep.Congo, Rep.Costa RicaCote d'IvoireCroatiaCyprusDjiboutiDominicaDominican RepublicEast Asia & PacificEast Asia & Pacific (excluding high income)East Asia & Pacific (IDA & IBRD countries)EcuadorEgypt, Arab Rep.El SalvadorEquatorial GuineaEritreaEthiopiaEuro areaEurope & Central AsiaEurope & Central Asia (excluding high income)Europe & Central Asia (IDA & IBRD countries)European UnionFijiFragile and conflict affected situationsGabonGambia, TheGeorgiaGhanaGrenadaGuatemalaGuineaGuinea-BissauGuyanaHaitiHeavily indebted poor countries (HIPC)High incomeHondurasIBRD onlyIDA & IBRD totalIDA blendIDA onlyIDA totalIndiaIndonesiaIran, Islamic Rep.IraqIsraelJamaicaJordanKazakhstanKenyaKiribatiKorea, Rep.KosovoKuwaitKyrgyz RepublicLao PDRLatin America & Caribbean Latin America & Caribbean (excluding high income)Latin America & the Caribbean (IDA & IBRD countries)Least developed countries: UN classificationLebanonLesothoLiberiaLibyaLow & middle incomeLow incomeLower middle incomeMacedonia, FYRMadagascarMalawiMalaysiaMaldivesMaliMaltaMarshall IslandsMauritaniaMauritiusMexicoMicronesia, Fed. Sts.Middle East & North Africa (excluding high income)Middle East & North Africa (IDA & IBRD countries)Middle incomeMoldovaMongoliaMontenegroMoroccoMozambiqueMyanmarNamibiaNepalNicaraguaNigerNigeriaNorth AmericaOECD membersOmanOther small statesPacific island small statesPakistanPalauPanamaPapua New GuineaParaguayPeruPhilippinesRwandaSamoaSao Tome and PrincipeSaudi ArabiaSenegalSerbiaSeychellesSierra LeoneSingaporeSloveniaSmall statesSolomon IslandsSouth AfricaSouth AsiaSouth Asia (IDA & IBRD)South SudanSri LankaSt. Kitts and NevisSt. LuciaSt. Vincent and the GrenadinesSub-Saharan Africa Sub-Saharan Africa (excluding high income)Sub-Saharan Africa (IDA & IBRD countries)SudanSurinameSwazilandSyrian Arab RepublicTajikistanTanzaniaThailandTimor-LesteTogoTongaTrinidad and TobagoTunisiaTurkeyTuvaluUgandaUkraineUpper middle incomeUruguayVanuatuVenezuela, RBVietnamWest Bank and GazaWorldYemen, Rep.ZambiaZimbabwe Timeline:
This timeline shows a graph from 1975 to 2015 of Turkey. No data until 1974. Number of actual observations by date: 41.
Source name:
World Development Indicators
Source organization:
Development Assistance Committee of the Organisation for Economic Co-operation and Development, Geographical Distribution of Financial Flows to Developing Countries, Development Co-operation Report, and International Development Statistics database. Data are available online at: www.oecd.org/dac/stats/idsonline. World Bank imports of good and services estimates are used for the denominator.
Categories, topics:
Aid Effectiveness
Last updated:
apr 23, 2017
Indicators value changes by year
Maximum:
10.301
jan 1, 1981
At the date of observation
Value
Absolute change
Change from previous value
jan 1, 1975
1.214
+1.214
0.0%
jan 1, 1976
1.146
-0.068
-5.61%
jan 1, 1977
2.215
+1.069
93.24%
jan 1, 1978
1.422
-0.793
-35.79%
jan 1, 1979
3.387
+1.965
138.15%
jan 1, 1980
9.422
+6.035
178.2%
jan 1, 1981
10.301
+0.879
9.33%
jan 1, 1982
6.916
-3.385
-32.86%
jan 1, 1983
5.804
-1.113
-16.09%
jan 1, 1984
3.06
-2.743
-47.27%
jan 1, 1985
1.824
-1.236
-40.38%
jan 1, 1986
1.255
-0.569
-31.18%
jan 1, 1987
2.39
+1.134
90.35%
jan 1, 1988
2.147
-0.243
-10.15%
jan 1, 1989
1.527
-0.62
-28.86%
jan 1, 1990
0.678
-0.849
-55.6%
jan 1, 1991
4.504
+3.826
564.11%
jan 1, 1992
5.799
+1.295
28.76%
jan 1, 1993
1.18
-4.62
-79.66%
jan 1, 1994
1.192
+0.012
1.04%
jan 1, 1995
0.648
-0.544
-45.64%
jan 1, 1996
0.698
+0.05
7.67%
jan 1, 1997
0.46
-0.237
-34.04%
jan 1, 1998
0.009
-0.451
-97.94%
jan 1, 1999
0.047
+0.037
393.23%
jan 1, 2000
0.02
-0.027
-58.27%
jan 1, 2001
0.482
+0.462
2.37K%
jan 1, 2002
0.253
-0.228
-47.39%
jan 1, 2003
0.463
+0.209
82.68%
jan 1, 2004
0.202
-0.26
-56.27%
jan 1, 2005
0.26
+0.057
28.28%
jan 1, 2006
0.298
+0.038
14.77%
jan 1, 2007
0.358
+0.06
20.19%
jan 1, 2008
0.413
+0.055
15.38%
jan 1, 2009
0.491
+0.078
18.82%
jan 1, 2010
0.825
+0.334
67.97%
jan 1, 2011
0.502
-0.323
-39.18%
jan 1, 2012
1.244
+0.742
147.94%
jan 1, 2013
1.193
-0.05
-4.05%
jan 1, 2014
1.015
-0.178
-14.95%
jan 1, 2015
1.272
+0.257
25.31%
Ranking of countries by current statistics by years


Comments: