29
/
en
AIzaSyAYiBZKx7MnpbEhh9jyipgxe19OcubqV5w
April 1, 2024
105244
Chile
CHL
true
2
1
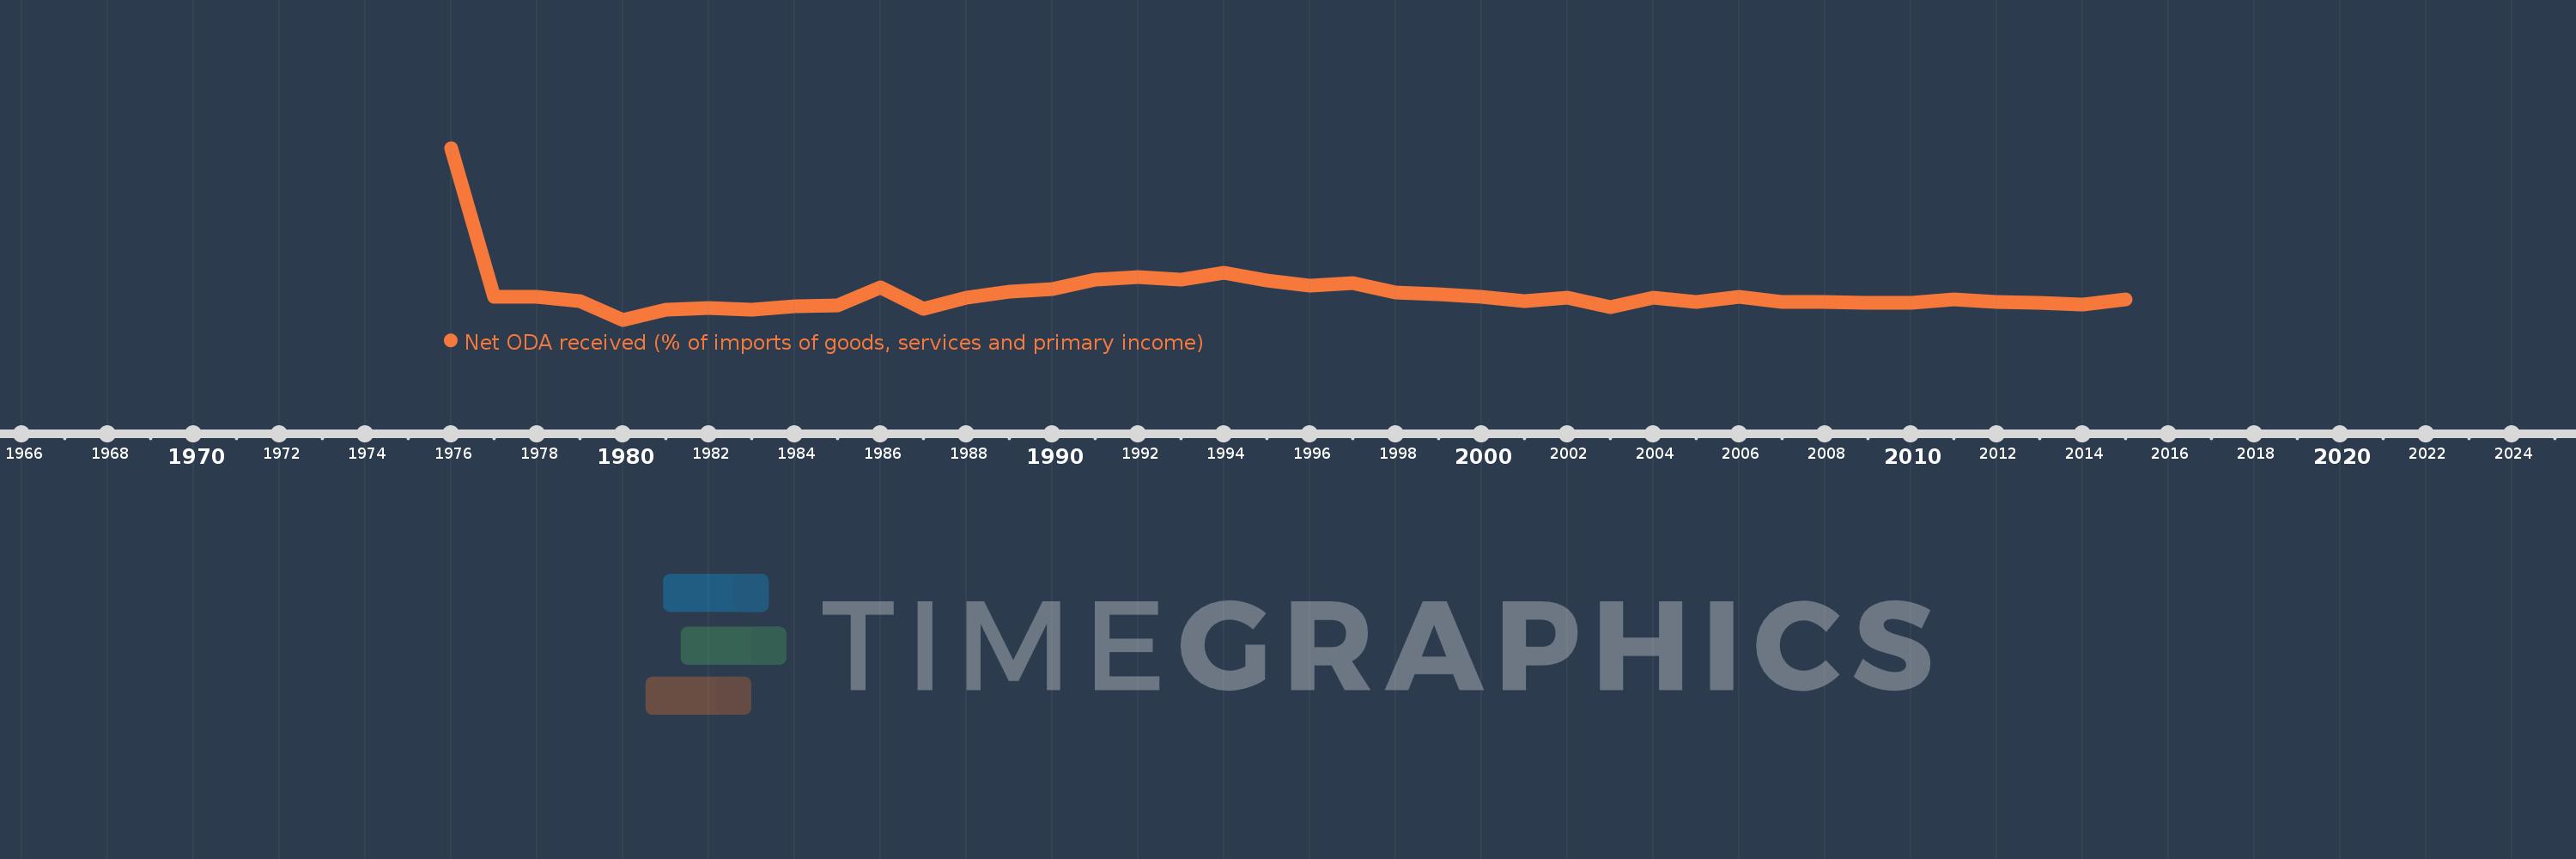
Net ODA received (% of imports of goods, services and primary income)
2015,2014,2013,2012,2011,2010,2009,2008,2007,2006,2005,2004,2003,2002,2001,2000,1999,1998,1997,1996,1995,1994,1993,1992,1991,1990,1989,1988,1987,1986,1985,1984,1983,1982,1981,1980,1979,1978,1977,1976
This statistics in other country:
AfghanistanAlbaniaAlgeriaAngolaAntigua and BarbudaArab WorldArgentinaArmeniaArubaAzerbaijanBahamas, TheBahrainBangladeshBarbadosBelarusBelizeBeninBhutanBoliviaBosnia and HerzegovinaBotswanaBrazilBurkina FasoBurundiCabo VerdeCambodiaCameroonCaribbean small statesCentral African RepublicCentral Europe and the BalticsChadChileChinaColombiaComorosCongo, Dem. Rep.Congo, Rep.Costa RicaCote d'IvoireCroatiaCyprusDjiboutiDominicaDominican RepublicEast Asia & PacificEast Asia & Pacific (excluding high income)East Asia & Pacific (IDA & IBRD countries)EcuadorEgypt, Arab Rep.El SalvadorEquatorial GuineaEritreaEthiopiaEuro areaEurope & Central AsiaEurope & Central Asia (excluding high income)Europe & Central Asia (IDA & IBRD countries)European UnionFijiFragile and conflict affected situationsGabonGambia, TheGeorgiaGhanaGrenadaGuatemalaGuineaGuinea-BissauGuyanaHaitiHeavily indebted poor countries (HIPC)High incomeHondurasIBRD onlyIDA & IBRD totalIDA blendIDA onlyIDA totalIndiaIndonesiaIran, Islamic Rep.IraqIsraelJamaicaJordanKazakhstanKenyaKiribatiKorea, Rep.KosovoKuwaitKyrgyz RepublicLao PDRLatin America & Caribbean Latin America & Caribbean (excluding high income)Latin America & the Caribbean (IDA & IBRD countries)Least developed countries: UN classificationLebanonLesothoLiberiaLibyaLow & middle incomeLow incomeLower middle incomeMacedonia, FYRMadagascarMalawiMalaysiaMaldivesMaliMaltaMarshall IslandsMauritaniaMauritiusMexicoMicronesia, Fed. Sts.Middle East & North Africa (excluding high income)Middle East & North Africa (IDA & IBRD countries)Middle incomeMoldovaMongoliaMontenegroMoroccoMozambiqueMyanmarNamibiaNepalNicaraguaNigerNigeriaNorth AmericaOECD membersOmanOther small statesPacific island small statesPakistanPalauPanamaPapua New GuineaParaguayPeruPhilippinesRwandaSamoaSao Tome and PrincipeSaudi ArabiaSenegalSerbiaSeychellesSierra LeoneSingaporeSloveniaSmall statesSolomon IslandsSouth AfricaSouth AsiaSouth Asia (IDA & IBRD)South SudanSri LankaSt. Kitts and NevisSt. LuciaSt. Vincent and the GrenadinesSub-Saharan Africa Sub-Saharan Africa (excluding high income)Sub-Saharan Africa (IDA & IBRD countries)SudanSurinameSwazilandSyrian Arab RepublicTajikistanTanzaniaThailandTimor-LesteTogoTongaTrinidad and TobagoTunisiaTurkeyTuvaluUgandaUkraineUpper middle incomeUruguayVanuatuVenezuela, RBVietnamWest Bank and GazaWorldYemen, Rep.ZambiaZimbabwe Timeline:
This timeline shows a graph from 1976 to 2015 of Chile. No data until 1975. Number of actual observations by date: 40.
Source name:
World Development Indicators
Source organization:
Development Assistance Committee of the Organisation for Economic Co-operation and Development, Geographical Distribution of Financial Flows to Developing Countries, Development Co-operation Report, and International Development Statistics database. Data are available online at: www.oecd.org/dac/stats/idsonline. World Bank imports of good and services estimates are used for the denominator.
Categories, topics:
Aid Effectiveness
Last updated:
apr 23, 2017
Indicators value changes by year
Minimum:
-0.462
jan 1, 1980
At the date of observation
Value
Absolute change
Change from previous value
jan 1, 1976
5.414
+5.414
0.0%
jan 1, 1977
0.314
-5.1
-94.2%
jan 1, 1978
0.324
+0.01
3.31%
jan 1, 1979
0.172
-0.153
-47.05%
jan 1, 1980
-0.462
-0.633
-368.86%
jan 1, 1981
-0.126
+0.336
-72.67%
jan 1, 1982
-0.069
+0.057
-45.05%
jan 1, 1983
-0.117
-0.047
68.47%
jan 1, 1984
0.002
+0.118
-101.42%
jan 1, 1985
0.033
+0.031
1.88K%
jan 1, 1986
0.639
+0.607
1.85K%
jan 1, 1987
-0.076
-0.716
-111.95%
jan 1, 1988
0.288
+0.365
-476.86%
jan 1, 1989
0.507
+0.219
76.04%
jan 1, 1990
0.573
+0.066
12.92%
jan 1, 1991
0.909
+0.337
58.78%
jan 1, 1992
1.003
+0.093
10.27%
jan 1, 1993
0.921
-0.082
-8.18%
jan 1, 1994
1.151
+0.23
25.0%
jan 1, 1995
0.887
-0.264
-22.92%
jan 1, 1996
0.715
-0.172
-19.35%
jan 1, 1997
0.793
+0.077
10.8%
jan 1, 1998
0.476
-0.317
-40.01%
jan 1, 1999
0.411
-0.064
-13.5%
jan 1, 2000
0.311
-0.1
-24.42%
jan 1, 2001
0.186
-0.125
-40.32%
jan 1, 2002
0.296
+0.111
59.76%
jan 1, 2003
-0.03
-0.326
-109.97%
jan 1, 2004
0.289
+0.318
-1.08K%
jan 1, 2005
0.138
-0.151
-52.38%
jan 1, 2006
0.327
+0.189
137.71%
jan 1, 2007
0.153
-0.174
-53.11%
jan 1, 2008
0.133
-0.02
-13.31%
jan 1, 2009
0.121
-0.012
-9.07%
jan 1, 2010
0.115
-0.006
-5.0%
jan 1, 2011
0.22
+0.105
91.29%
jan 1, 2012
0.153
-0.067
-30.4%
jan 1, 2013
0.114
-0.039
-25.69%
jan 1, 2014
0.072
-0.041
-36.42%
jan 1, 2015
0.242
+0.169
234.59%
Ranking of countries by current statistics by years


Comments: