29
/
en
AIzaSyAYiBZKx7MnpbEhh9jyipgxe19OcubqV5w
April 1, 2024
130858
Ethiopia
ETH
true
2
1
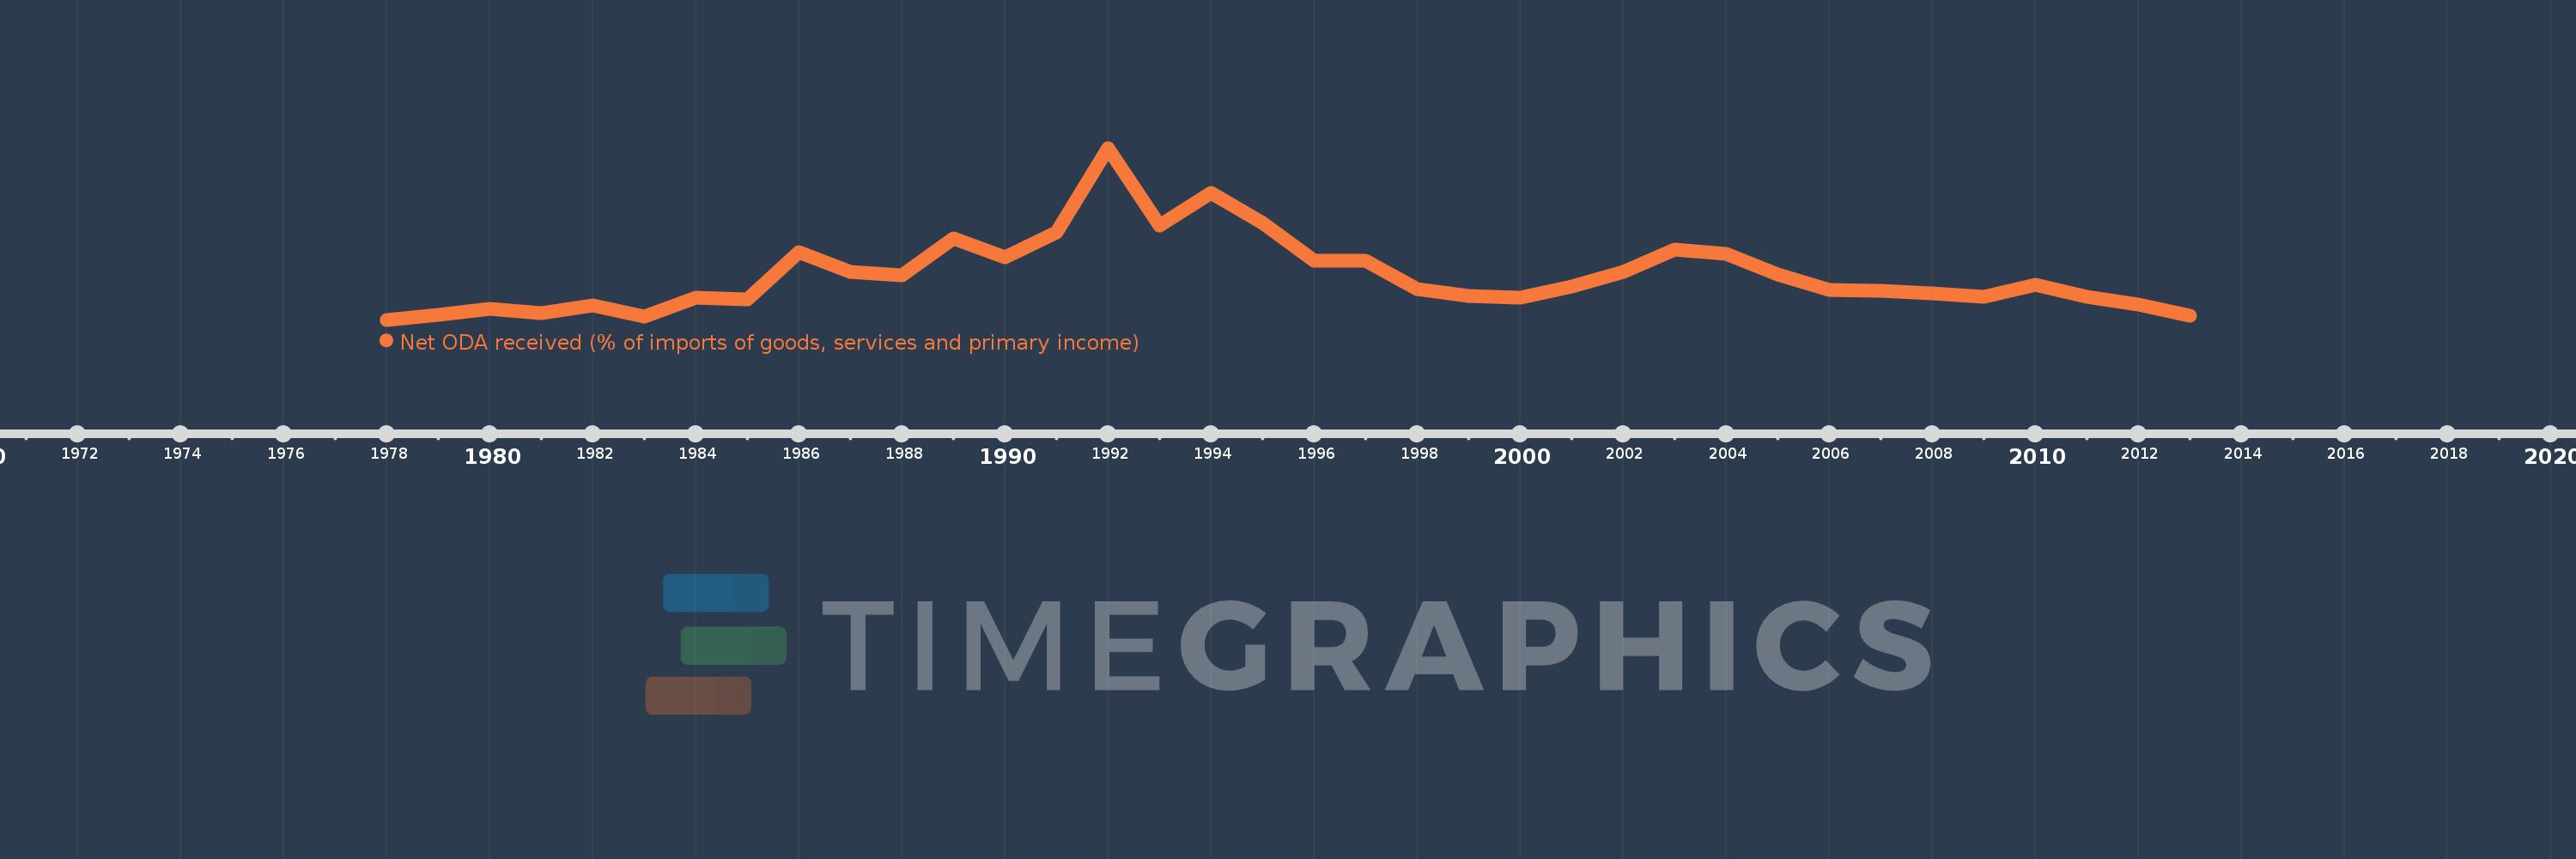
Net ODA received (% of imports of goods, services and primary income)
2013,2012,2011,2010,2009,2008,2007,2006,2005,2004,2003,2002,2001,2000,1999,1998,1997,1996,1995,1994,1993,1992,1991,1990,1989,1988,1987,1986,1985,1984,1983,1982,1981,1980,1979,1978
This statistics in other country:
AfghanistanAlbaniaAlgeriaAngolaAntigua and BarbudaArab WorldArgentinaArmeniaArubaAzerbaijanBahamas, TheBahrainBangladeshBarbadosBelarusBelizeBeninBhutanBoliviaBosnia and HerzegovinaBotswanaBrazilBurkina FasoBurundiCabo VerdeCambodiaCameroonCaribbean small statesCentral African RepublicCentral Europe and the BalticsChadChileChinaColombiaComorosCongo, Dem. Rep.Congo, Rep.Costa RicaCote d'IvoireCroatiaCyprusDjiboutiDominicaDominican RepublicEast Asia & PacificEast Asia & Pacific (excluding high income)East Asia & Pacific (IDA & IBRD countries)EcuadorEgypt, Arab Rep.El SalvadorEquatorial GuineaEritreaEthiopiaEuro areaEurope & Central AsiaEurope & Central Asia (excluding high income)Europe & Central Asia (IDA & IBRD countries)European UnionFijiFragile and conflict affected situationsGabonGambia, TheGeorgiaGhanaGrenadaGuatemalaGuineaGuinea-BissauGuyanaHaitiHeavily indebted poor countries (HIPC)High incomeHondurasIBRD onlyIDA & IBRD totalIDA blendIDA onlyIDA totalIndiaIndonesiaIran, Islamic Rep.IraqIsraelJamaicaJordanKazakhstanKenyaKiribatiKorea, Rep.KosovoKuwaitKyrgyz RepublicLao PDRLatin America & Caribbean Latin America & Caribbean (excluding high income)Latin America & the Caribbean (IDA & IBRD countries)Least developed countries: UN classificationLebanonLesothoLiberiaLibyaLow & middle incomeLow incomeLower middle incomeMacedonia, FYRMadagascarMalawiMalaysiaMaldivesMaliMaltaMarshall IslandsMauritaniaMauritiusMexicoMicronesia, Fed. Sts.Middle East & North Africa (excluding high income)Middle East & North Africa (IDA & IBRD countries)Middle incomeMoldovaMongoliaMontenegroMoroccoMozambiqueMyanmarNamibiaNepalNicaraguaNigerNigeriaNorth AmericaOECD membersOmanOther small statesPacific island small statesPakistanPalauPanamaPapua New GuineaParaguayPeruPhilippinesRwandaSamoaSao Tome and PrincipeSaudi ArabiaSenegalSerbiaSeychellesSierra LeoneSingaporeSloveniaSmall statesSolomon IslandsSouth AfricaSouth AsiaSouth Asia (IDA & IBRD)South SudanSri LankaSt. Kitts and NevisSt. LuciaSt. Vincent and the GrenadinesSub-Saharan Africa Sub-Saharan Africa (excluding high income)Sub-Saharan Africa (IDA & IBRD countries)SudanSurinameSwazilandSyrian Arab RepublicTajikistanTanzaniaThailandTimor-LesteTogoTongaTrinidad and TobagoTunisiaTurkeyTuvaluUgandaUkraineUpper middle incomeUruguayVanuatuVenezuela, RBVietnamWest Bank and GazaWorldYemen, Rep.ZambiaZimbabwe Timeline:
This timeline shows a graph from 1978 to 2013 of Ethiopia. No data until 1977. Number of actual observations by date: 36.
Source name:
World Development Indicators
Source organization:
Development Assistance Committee of the Organisation for Economic Co-operation and Development, Geographical Distribution of Financial Flows to Developing Countries, Development Co-operation Report, and International Development Statistics database. Data are available online at: www.oecd.org/dac/stats/idsonline. World Bank imports of good and services estimates are used for the denominator.
Categories, topics:
Aid Effectiveness
Last updated:
apr 23, 2017
Indicators value changes by year
Minimum:
19.996
jan 1, 1978
Maximum:
128.171
jan 1, 1992
At the date of observation
Value
Absolute change
Change from previous value
jan 1, 1978
19.996
+19.996
0.0%
jan 1, 1979
23.214
+3.218
16.09%
jan 1, 1980
26.819
+3.604
15.53%
jan 1, 1981
24.225
-2.593
-9.67%
jan 1, 1982
28.817
+4.592
18.96%
jan 1, 1983
21.784
-7.033
-24.41%
jan 1, 1984
34.06
+12.276
56.35%
jan 1, 1985
33.019
-1.041
-3.06%
jan 1, 1986
62.408
+29.389
89.01%
jan 1, 1987
49.874
-12.534
-20.08%
jan 1, 1988
47.98
-1.894
-3.8%
jan 1, 1989
71.046
+23.066
48.07%
jan 1, 1990
59.349
-11.697
-16.46%
jan 1, 1991
74.834
+15.485
26.09%
jan 1, 1992
128.171
+53.337
71.27%
jan 1, 1993
79.346
-48.826
-38.09%
jan 1, 1994
99.754
+20.408
25.72%
jan 1, 1995
81.113
-18.641
-18.69%
jan 1, 1996
57.183
-23.93
-29.5%
jan 1, 1997
57.154
-0.029
-0.05%
jan 1, 1998
39.575
-17.579
-30.76%
jan 1, 1999
35.123
-4.452
-11.25%
jan 1, 2000
33.778
-1.345
-3.83%
jan 1, 2001
41.077
+7.299
21.61%
jan 1, 2002
50.242
+9.165
22.31%
jan 1, 2003
63.961
+13.719
27.31%
jan 1, 2004
61.45
-2.511
-3.93%
jan 1, 2005
48.279
-13.171
-21.43%
jan 1, 2006
39.003
-9.275
-19.21%
jan 1, 2007
38.268
-0.735
-1.88%
jan 1, 2008
36.857
-1.411
-3.69%
jan 1, 2009
34.552
-2.305
-6.25%
jan 1, 2010
42.029
+7.477
21.64%
jan 1, 2011
34.586
-7.443
-17.71%
jan 1, 2012
29.761
-4.824
-13.95%
jan 1, 2013
22.624
-7.137
-23.98%
Ranking of countries by current statistics by years


Comments: