29
/
en
AIzaSyAYiBZKx7MnpbEhh9jyipgxe19OcubqV5w
April 1, 2024
250145
St. Kitts and Nevis
KNA
true
2
1
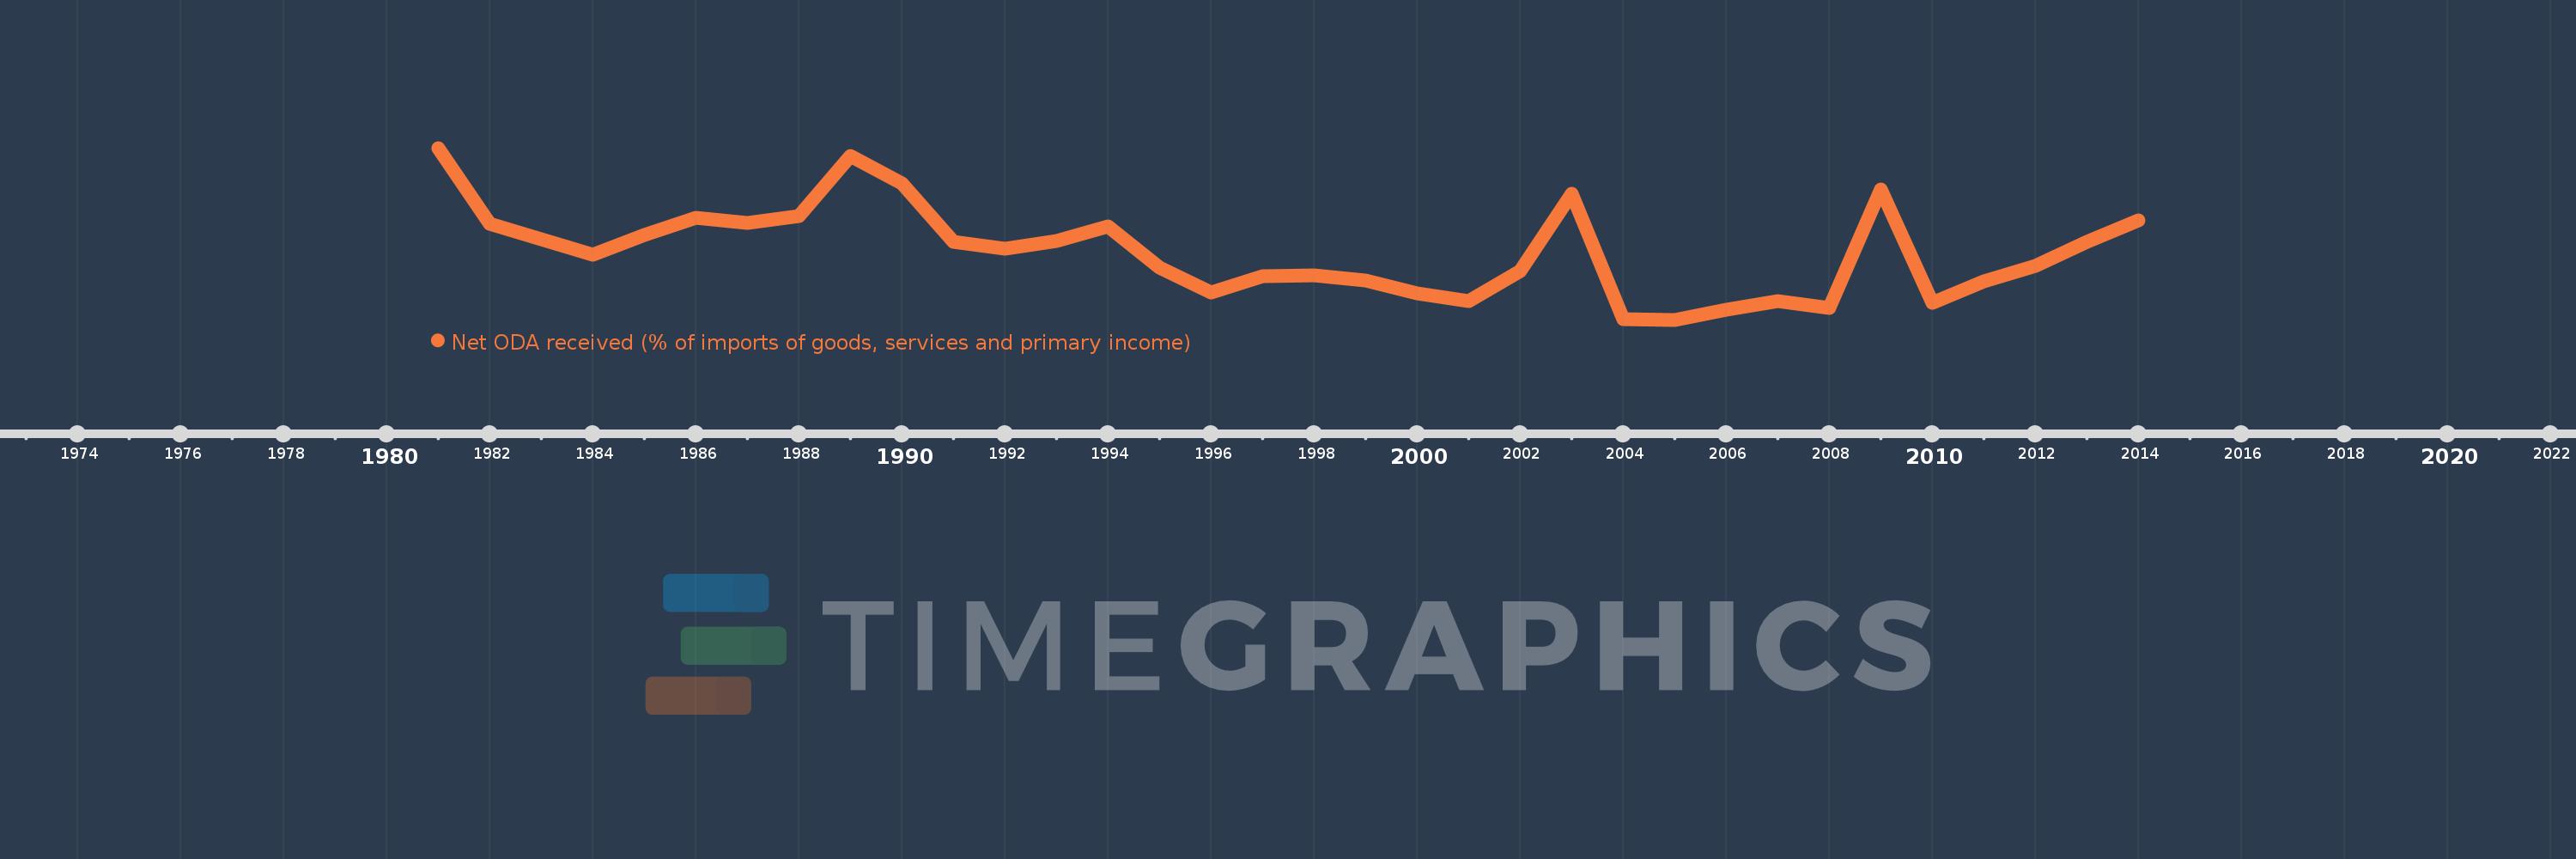
Net ODA received (% of imports of goods, services and primary income)
2014,2013,2012,2011,2010,2009,2008,2007,2006,2005,2004,2003,2002,2001,2000,1999,1998,1997,1996,1995,1994,1993,1992,1991,1990,1989,1988,1987,1986,1985,1984,1983,1982,1981
This statistics in other country:
AfghanistanAlbaniaAlgeriaAngolaAntigua and BarbudaArab WorldArgentinaArmeniaArubaAzerbaijanBahamas, TheBahrainBangladeshBarbadosBelarusBelizeBeninBhutanBoliviaBosnia and HerzegovinaBotswanaBrazilBurkina FasoBurundiCabo VerdeCambodiaCameroonCaribbean small statesCentral African RepublicCentral Europe and the BalticsChadChileChinaColombiaComorosCongo, Dem. Rep.Congo, Rep.Costa RicaCote d'IvoireCroatiaCyprusDjiboutiDominicaDominican RepublicEast Asia & PacificEast Asia & Pacific (excluding high income)East Asia & Pacific (IDA & IBRD countries)EcuadorEgypt, Arab Rep.El SalvadorEquatorial GuineaEritreaEthiopiaEuro areaEurope & Central AsiaEurope & Central Asia (excluding high income)Europe & Central Asia (IDA & IBRD countries)European UnionFijiFragile and conflict affected situationsGabonGambia, TheGeorgiaGhanaGrenadaGuatemalaGuineaGuinea-BissauGuyanaHaitiHeavily indebted poor countries (HIPC)High incomeHondurasIBRD onlyIDA & IBRD totalIDA blendIDA onlyIDA totalIndiaIndonesiaIran, Islamic Rep.IraqIsraelJamaicaJordanKazakhstanKenyaKiribatiKorea, Rep.KosovoKuwaitKyrgyz RepublicLao PDRLatin America & Caribbean Latin America & Caribbean (excluding high income)Latin America & the Caribbean (IDA & IBRD countries)Least developed countries: UN classificationLebanonLesothoLiberiaLibyaLow & middle incomeLow incomeLower middle incomeMacedonia, FYRMadagascarMalawiMalaysiaMaldivesMaliMaltaMarshall IslandsMauritaniaMauritiusMexicoMicronesia, Fed. Sts.Middle East & North Africa (excluding high income)Middle East & North Africa (IDA & IBRD countries)Middle incomeMoldovaMongoliaMontenegroMoroccoMozambiqueMyanmarNamibiaNepalNicaraguaNigerNigeriaNorth AmericaOECD membersOmanOther small statesPacific island small statesPakistanPalauPanamaPapua New GuineaParaguayPeruPhilippinesRwandaSamoaSao Tome and PrincipeSaudi ArabiaSenegalSerbiaSeychellesSierra LeoneSingaporeSloveniaSmall statesSolomon IslandsSouth AfricaSouth AsiaSouth Asia (IDA & IBRD)South SudanSri LankaSt. Kitts and NevisSt. LuciaSt. Vincent and the GrenadinesSub-Saharan Africa Sub-Saharan Africa (excluding high income)Sub-Saharan Africa (IDA & IBRD countries)SudanSurinameSwazilandSyrian Arab RepublicTajikistanTanzaniaThailandTimor-LesteTogoTongaTrinidad and TobagoTunisiaTurkeyTuvaluUgandaUkraineUpper middle incomeUruguayVanuatuVenezuela, RBVietnamWest Bank and GazaWorldYemen, Rep.ZambiaZimbabwe Timeline:
This timeline shows a graph from 1981 to 2014 of St. Kitts and Nevis. No data until 1980. Number of actual observations by date: 34.
Source name:
World Development Indicators
Source organization:
Development Assistance Committee of the Organisation for Economic Co-operation and Development, Geographical Distribution of Financial Flows to Developing Countries, Development Co-operation Report, and International Development Statistics database. Data are available online at: www.oecd.org/dac/stats/idsonline. World Bank imports of good and services estimates are used for the denominator.
Categories, topics:
Aid Effectiveness
Last updated:
apr 23, 2017
Indicators value changes by year
Maximum:
12.782
jan 1, 1981
At the date of observation
Value
Absolute change
Change from previous value
jan 1, 1981
12.782
+12.782
0.0%
jan 1, 1982
7.151
-5.631
-44.05%
jan 1, 1983
6.02
-1.131
-15.82%
jan 1, 1984
4.857
-1.163
-19.31%
jan 1, 1985
6.311
+1.454
29.93%
jan 1, 1986
7.591
+1.281
20.29%
jan 1, 1987
7.205
-0.387
-5.09%
jan 1, 1988
7.734
+0.529
7.34%
jan 1, 1989
12.2
+4.466
57.74%
jan 1, 1990
10.173
-2.027
-16.61%
jan 1, 1991
5.794
-4.378
-43.04%
jan 1, 1992
5.309
-0.486
-8.38%
jan 1, 1993
5.839
+0.53
9.99%
jan 1, 1994
6.961
+1.122
19.21%
jan 1, 1995
3.905
-3.056
-43.91%
jan 1, 1996
2.054
-1.851
-47.41%
jan 1, 1997
3.222
+1.168
56.88%
jan 1, 1998
3.288
+0.067
2.07%
jan 1, 1999
2.957
-0.331
-10.08%
jan 1, 2000
1.945
-1.012
-34.24%
jan 1, 2001
1.371
-0.573
-29.47%
jan 1, 2002
3.604
+2.233
162.81%
jan 1, 2003
9.371
+5.767
160.0%
jan 1, 2004
0.052
-9.319
-99.44%
jan 1, 2005
0.014
-0.039
-73.51%
jan 1, 2006
0.767
+0.753
5.42K%
jan 1, 2007
1.409
+0.642
83.66%
jan 1, 2008
0.878
-0.531
-37.7%
jan 1, 2009
9.727
+8.849
1.01K%
jan 1, 2010
1.25
-8.477
-87.15%
jan 1, 2011
2.848
+1.599
127.94%
jan 1, 2012
4.035
+1.187
41.68%
jan 1, 2013
5.821
+1.785
44.24%
jan 1, 2014
7.382
+1.561
26.82%
Ranking of countries by current statistics by years


Comments: