29
/
en
AIzaSyAYiBZKx7MnpbEhh9jyipgxe19OcubqV5w
April 1, 2024
189343
Maldives
MDV
true
2
1
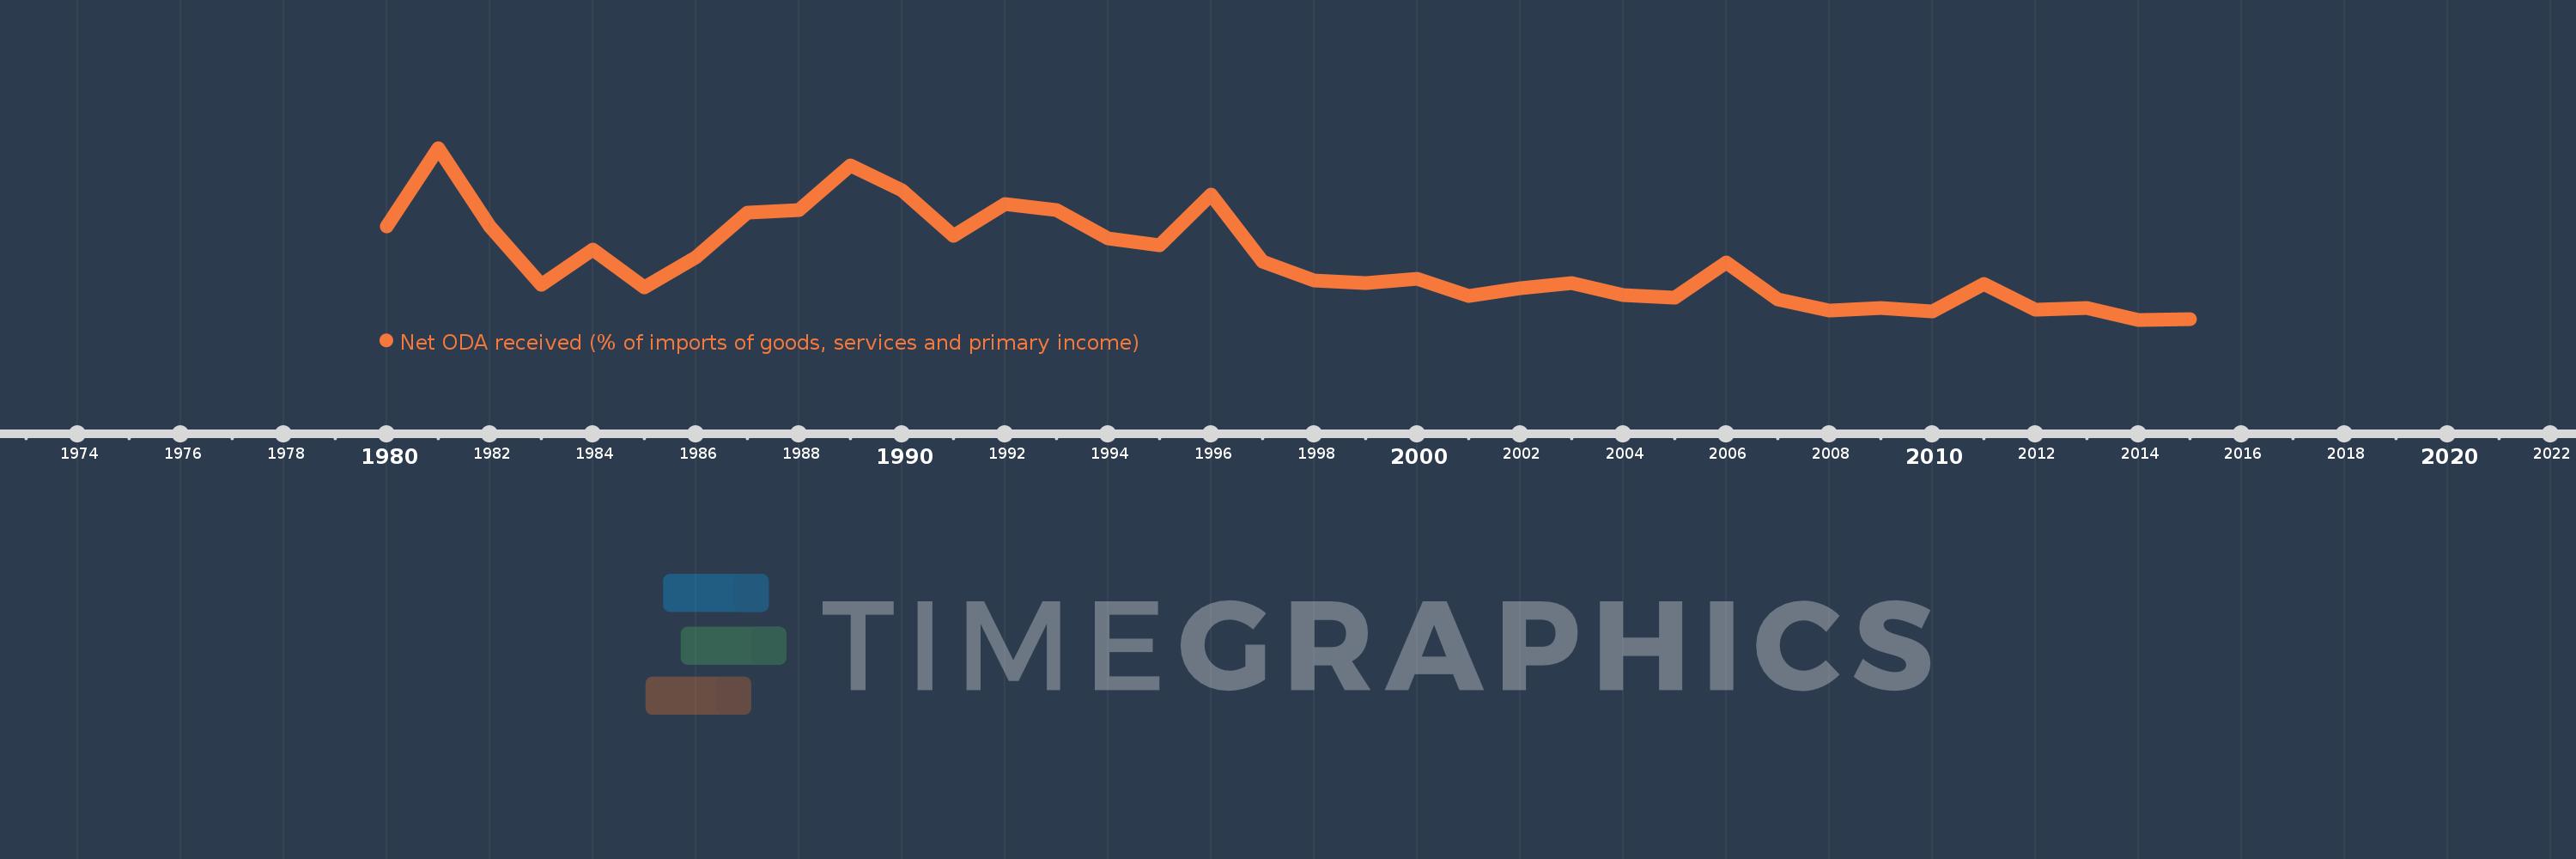
Net ODA received (% of imports of goods, services and primary income)
2015,2014,2013,2012,2011,2010,2009,2008,2007,2006,2005,2004,2003,2002,2001,2000,1999,1998,1997,1996,1995,1994,1993,1992,1991,1990,1989,1988,1987,1986,1985,1984,1983,1982,1981,1980
This statistics in other country:
AfghanistanAlbaniaAlgeriaAngolaAntigua and BarbudaArab WorldArgentinaArmeniaArubaAzerbaijanBahamas, TheBahrainBangladeshBarbadosBelarusBelizeBeninBhutanBoliviaBosnia and HerzegovinaBotswanaBrazilBurkina FasoBurundiCabo VerdeCambodiaCameroonCaribbean small statesCentral African RepublicCentral Europe and the BalticsChadChileChinaColombiaComorosCongo, Dem. Rep.Congo, Rep.Costa RicaCote d'IvoireCroatiaCyprusDjiboutiDominicaDominican RepublicEast Asia & PacificEast Asia & Pacific (excluding high income)East Asia & Pacific (IDA & IBRD countries)EcuadorEgypt, Arab Rep.El SalvadorEquatorial GuineaEritreaEthiopiaEuro areaEurope & Central AsiaEurope & Central Asia (excluding high income)Europe & Central Asia (IDA & IBRD countries)European UnionFijiFragile and conflict affected situationsGabonGambia, TheGeorgiaGhanaGrenadaGuatemalaGuineaGuinea-BissauGuyanaHaitiHeavily indebted poor countries (HIPC)High incomeHondurasIBRD onlyIDA & IBRD totalIDA blendIDA onlyIDA totalIndiaIndonesiaIran, Islamic Rep.IraqIsraelJamaicaJordanKazakhstanKenyaKiribatiKorea, Rep.KosovoKuwaitKyrgyz RepublicLao PDRLatin America & Caribbean Latin America & Caribbean (excluding high income)Latin America & the Caribbean (IDA & IBRD countries)Least developed countries: UN classificationLebanonLesothoLiberiaLibyaLow & middle incomeLow incomeLower middle incomeMacedonia, FYRMadagascarMalawiMalaysiaMaldivesMaliMaltaMarshall IslandsMauritaniaMauritiusMexicoMicronesia, Fed. Sts.Middle East & North Africa (excluding high income)Middle East & North Africa (IDA & IBRD countries)Middle incomeMoldovaMongoliaMontenegroMoroccoMozambiqueMyanmarNamibiaNepalNicaraguaNigerNigeriaNorth AmericaOECD membersOmanOther small statesPacific island small statesPakistanPalauPanamaPapua New GuineaParaguayPeruPhilippinesRwandaSamoaSao Tome and PrincipeSaudi ArabiaSenegalSerbiaSeychellesSierra LeoneSingaporeSloveniaSmall statesSolomon IslandsSouth AfricaSouth AsiaSouth Asia (IDA & IBRD)South SudanSri LankaSt. Kitts and NevisSt. LuciaSt. Vincent and the GrenadinesSub-Saharan Africa Sub-Saharan Africa (excluding high income)Sub-Saharan Africa (IDA & IBRD countries)SudanSurinameSwazilandSyrian Arab RepublicTajikistanTanzaniaThailandTimor-LesteTogoTongaTrinidad and TobagoTunisiaTurkeyTuvaluUgandaUkraineUpper middle incomeUruguayVanuatuVenezuela, RBVietnamWest Bank and GazaWorldYemen, Rep.ZambiaZimbabwe Timeline:
This timeline shows a graph from 1980 to 2015 of Maldives. No data until 1979. Number of actual observations by date: 36.
Source name:
World Development Indicators
Source organization:
Development Assistance Committee of the Organisation for Economic Co-operation and Development, Geographical Distribution of Financial Flows to Developing Countries, Development Co-operation Report, and International Development Statistics database. Data are available online at: www.oecd.org/dac/stats/idsonline. World Bank imports of good and services estimates are used for the denominator.
Categories, topics:
Aid Effectiveness
Last updated:
apr 23, 2017
Indicators value changes by year
Maximum:
23.285
jan 1, 1981
At the date of observation
Value
Absolute change
Change from previous value
jan 1, 1980
13.002
+13.002
0.0%
jan 1, 1981
23.285
+10.283
79.09%
jan 1, 1982
13.048
-10.237
-43.96%
jan 1, 1983
5.312
-7.737
-59.29%
jan 1, 1984
9.972
+4.66
87.73%
jan 1, 1985
5.028
-4.944
-49.58%
jan 1, 1986
8.924
+3.896
77.49%
jan 1, 1987
14.858
+5.934
66.5%
jan 1, 1988
15.18
+0.321
2.16%
jan 1, 1989
20.965
+5.786
38.11%
jan 1, 1990
17.72
-3.246
-15.48%
jan 1, 1991
11.738
-5.982
-33.76%
jan 1, 1992
15.896
+4.158
35.43%
jan 1, 1993
15.171
-0.725
-4.56%
jan 1, 1994
11.417
-3.753
-24.74%
jan 1, 1995
10.543
-0.875
-7.66%
jan 1, 1996
17.138
+6.596
62.56%
jan 1, 1997
8.421
-8.717
-50.86%
jan 1, 1998
5.939
-2.482
-29.48%
jan 1, 1999
5.591
-0.348
-5.85%
jan 1, 2000
6.111
+0.519
9.29%
jan 1, 2001
3.892
-2.218
-36.3%
jan 1, 2002
4.939
+1.047
26.89%
jan 1, 2003
5.526
+0.587
11.88%
jan 1, 2004
4.013
-1.513
-27.39%
jan 1, 2005
3.68
-0.333
-8.29%
jan 1, 2006
8.328
+4.649
126.33%
jan 1, 2007
3.402
-4.926
-59.15%
jan 1, 2008
1.928
-1.474
-43.32%
jan 1, 2009
2.285
+0.356
18.46%
jan 1, 2010
1.888
-0.396
-17.35%
jan 1, 2011
5.514
+3.626
192.02%
jan 1, 2012
2.054
-3.46
-62.75%
jan 1, 2013
2.333
+0.279
13.6%
jan 1, 2014
0.766
-1.568
-67.18%
jan 1, 2015
0.796
+0.03
3.9%
Ranking of countries by current statistics by years


Comments: