29
/
en
AIzaSyAYiBZKx7MnpbEhh9jyipgxe19OcubqV5w
April 1, 2024
253386
Sudan
SDN
true
2
1
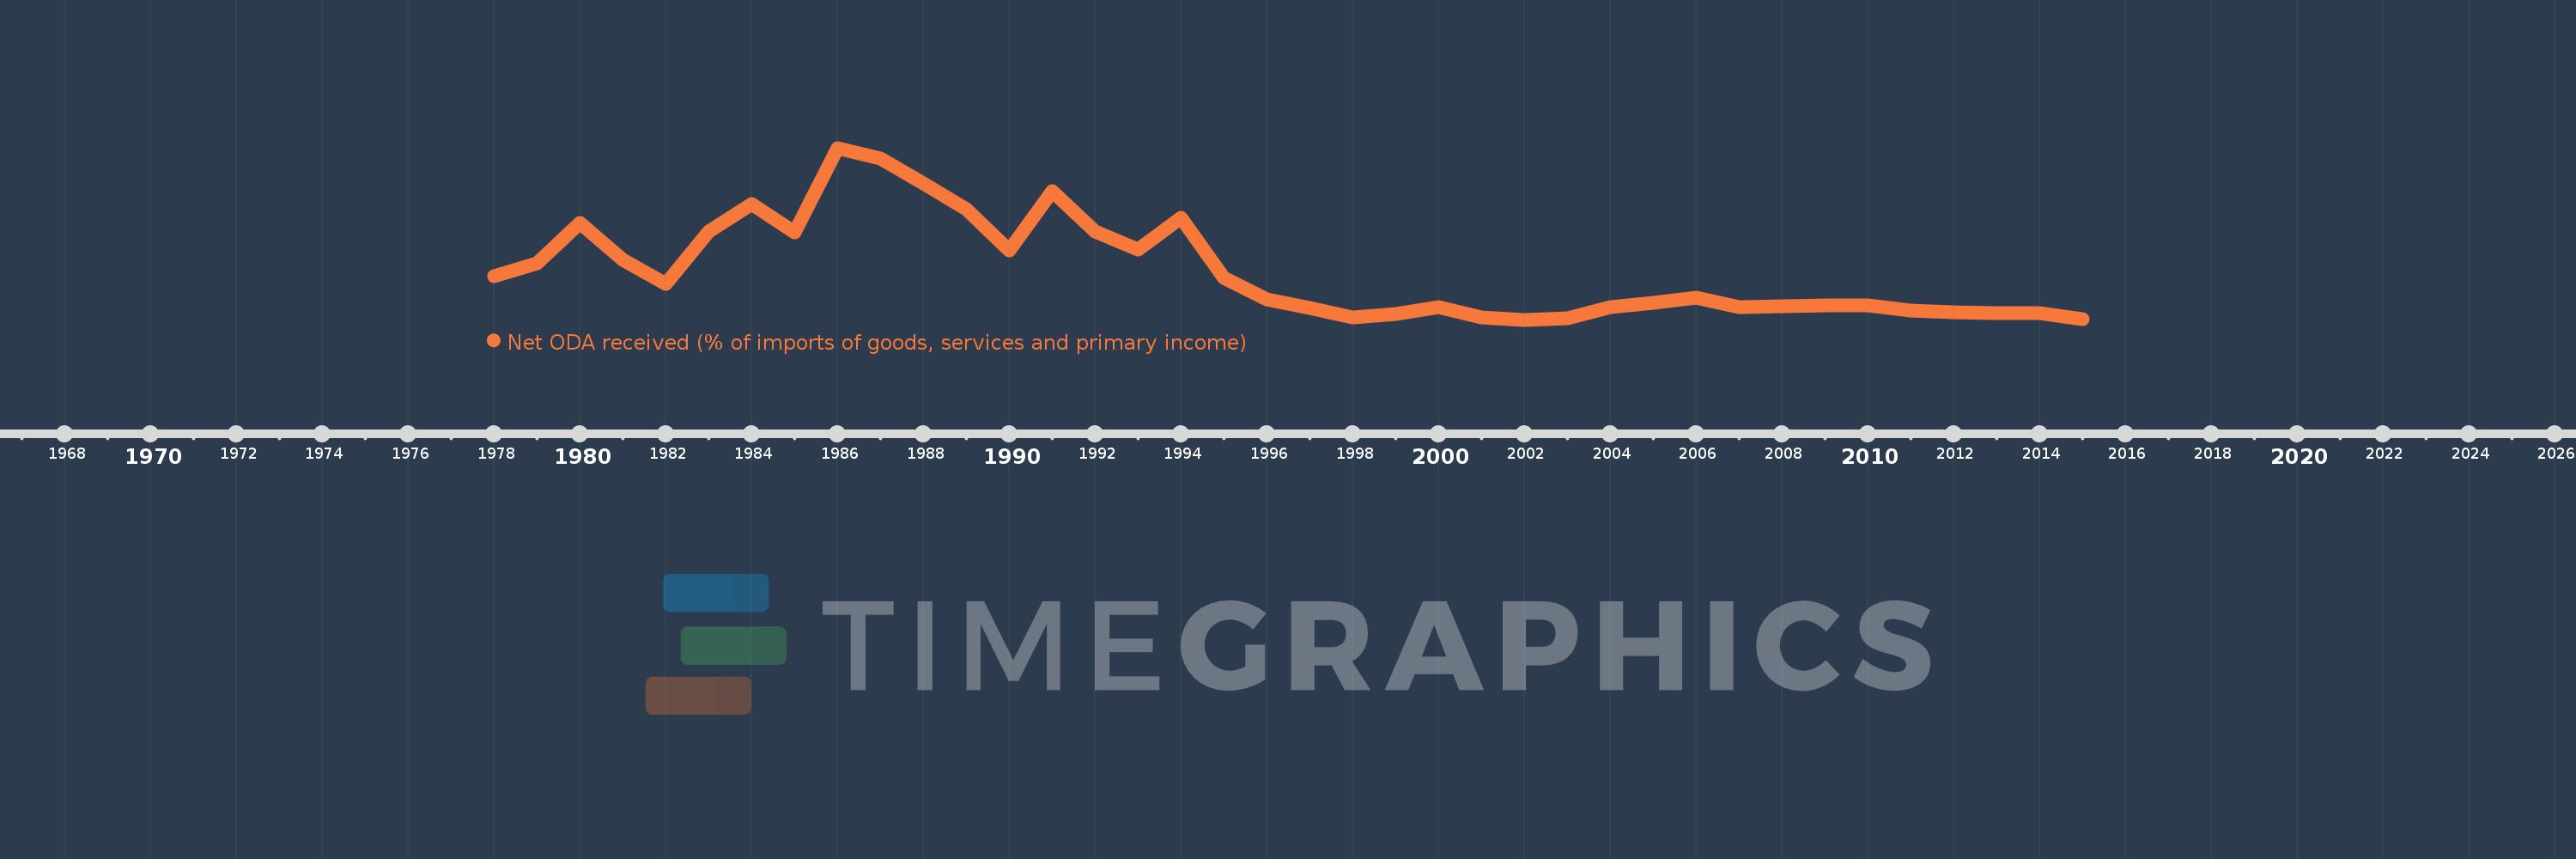
Net ODA received (% of imports of goods, services and primary income)
2015,2014,2013,2012,2011,2010,2009,2008,2007,2006,2005,2004,2003,2002,2001,2000,1999,1998,1997,1996,1995,1994,1993,1992,1991,1990,1989,1988,1987,1986,1985,1984,1983,1982,1981,1980,1979,1978
This statistics in other country:
AfghanistanAlbaniaAlgeriaAngolaAntigua and BarbudaArab WorldArgentinaArmeniaArubaAzerbaijanBahamas, TheBahrainBangladeshBarbadosBelarusBelizeBeninBhutanBoliviaBosnia and HerzegovinaBotswanaBrazilBurkina FasoBurundiCabo VerdeCambodiaCameroonCaribbean small statesCentral African RepublicCentral Europe and the BalticsChadChileChinaColombiaComorosCongo, Dem. Rep.Congo, Rep.Costa RicaCote d'IvoireCroatiaCyprusDjiboutiDominicaDominican RepublicEast Asia & PacificEast Asia & Pacific (excluding high income)East Asia & Pacific (IDA & IBRD countries)EcuadorEgypt, Arab Rep.El SalvadorEquatorial GuineaEritreaEthiopiaEuro areaEurope & Central AsiaEurope & Central Asia (excluding high income)Europe & Central Asia (IDA & IBRD countries)European UnionFijiFragile and conflict affected situationsGabonGambia, TheGeorgiaGhanaGrenadaGuatemalaGuineaGuinea-BissauGuyanaHaitiHeavily indebted poor countries (HIPC)High incomeHondurasIBRD onlyIDA & IBRD totalIDA blendIDA onlyIDA totalIndiaIndonesiaIran, Islamic Rep.IraqIsraelJamaicaJordanKazakhstanKenyaKiribatiKorea, Rep.KosovoKuwaitKyrgyz RepublicLao PDRLatin America & Caribbean Latin America & Caribbean (excluding high income)Latin America & the Caribbean (IDA & IBRD countries)Least developed countries: UN classificationLebanonLesothoLiberiaLibyaLow & middle incomeLow incomeLower middle incomeMacedonia, FYRMadagascarMalawiMalaysiaMaldivesMaliMaltaMarshall IslandsMauritaniaMauritiusMexicoMicronesia, Fed. Sts.Middle East & North Africa (excluding high income)Middle East & North Africa (IDA & IBRD countries)Middle incomeMoldovaMongoliaMontenegroMoroccoMozambiqueMyanmarNamibiaNepalNicaraguaNigerNigeriaNorth AmericaOECD membersOmanOther small statesPacific island small statesPakistanPalauPanamaPapua New GuineaParaguayPeruPhilippinesRwandaSamoaSao Tome and PrincipeSaudi ArabiaSenegalSerbiaSeychellesSierra LeoneSingaporeSloveniaSmall statesSolomon IslandsSouth AfricaSouth AsiaSouth Asia (IDA & IBRD)South SudanSri LankaSt. Kitts and NevisSt. LuciaSt. Vincent and the GrenadinesSub-Saharan Africa Sub-Saharan Africa (excluding high income)Sub-Saharan Africa (IDA & IBRD countries)SudanSurinameSwazilandSyrian Arab RepublicTajikistanTanzaniaThailandTimor-LesteTogoTongaTrinidad and TobagoTunisiaTurkeyTuvaluUgandaUkraineUpper middle incomeUruguayVanuatuVenezuela, RBVietnamWest Bank and GazaWorldYemen, Rep.ZambiaZimbabwe Timeline:
This timeline shows a graph from 1978 to 2015 of Sudan. No data until 1977. Number of actual observations by date: 38.
Source name:
World Development Indicators
Source organization:
Development Assistance Committee of the Organisation for Economic Co-operation and Development, Geographical Distribution of Financial Flows to Developing Countries, Development Co-operation Report, and International Development Statistics database. Data are available online at: www.oecd.org/dac/stats/idsonline. World Bank imports of good and services estimates are used for the denominator.
Categories, topics:
Aid Effectiveness
Last updated:
apr 23, 2017
Indicators value changes by year
Maximum:
108.263
jan 1, 1986
At the date of observation
Value
Absolute change
Change from previous value
jan 1, 1978
32.803
+32.803
0.0%
jan 1, 1979
40.692
+7.889
24.05%
jan 1, 1980
64.038
+23.346
57.37%
jan 1, 1981
42.638
-21.4
-33.42%
jan 1, 1982
28.113
-14.524
-34.06%
jan 1, 1983
58.94
+30.827
109.65%
jan 1, 1984
75.122
+16.182
27.45%
jan 1, 1985
58.67
-16.451
-21.9%
jan 1, 1986
108.263
+49.592
84.53%
jan 1, 1987
102.119
-6.144
-5.68%
jan 1, 1988
87.489
-14.629
-14.33%
jan 1, 1989
72.137
-15.352
-17.55%
jan 1, 1990
47.969
-24.168
-33.5%
jan 1, 1991
82.768
+34.799
72.54%
jan 1, 1992
59.203
-23.565
-28.47%
jan 1, 1993
48.414
-10.789
-18.22%
jan 1, 1994
67.459
+19.046
39.34%
jan 1, 1995
31.75
-35.709
-52.93%
jan 1, 1996
19.066
-12.684
-39.95%
jan 1, 1997
14.127
-4.939
-25.9%
jan 1, 1998
8.659
-5.469
-38.71%
jan 1, 1999
10.831
+2.172
25.08%
jan 1, 2000
14.855
+4.024
37.15%
jan 1, 2001
8.662
-6.193
-41.69%
jan 1, 2002
7.31
-1.352
-15.61%
jan 1, 2003
8.13
+0.82
11.22%
jan 1, 2004
14.614
+6.484
79.76%
jan 1, 2005
17.19
+2.576
17.63%
jan 1, 2006
20.518
+3.328
19.36%
jan 1, 2007
14.907
-5.611
-27.35%
jan 1, 2008
15.199
+0.293
1.96%
jan 1, 2009
15.663
+0.464
3.05%
jan 1, 2010
15.927
+0.264
1.68%
jan 1, 2011
12.937
-2.989
-18.77%
jan 1, 2012
11.746
-1.191
-9.21%
jan 1, 2013
11.132
-0.614
-5.22%
jan 1, 2014
11.078
-0.054
-0.49%
jan 1, 2015
7.808
-3.27
-29.52%
Ranking of countries by current statistics by years


Comments: