29
/
en
AIzaSyAYiBZKx7MnpbEhh9jyipgxe19OcubqV5w
April 1, 2024
146038
Guinea
GIN
true
2
1
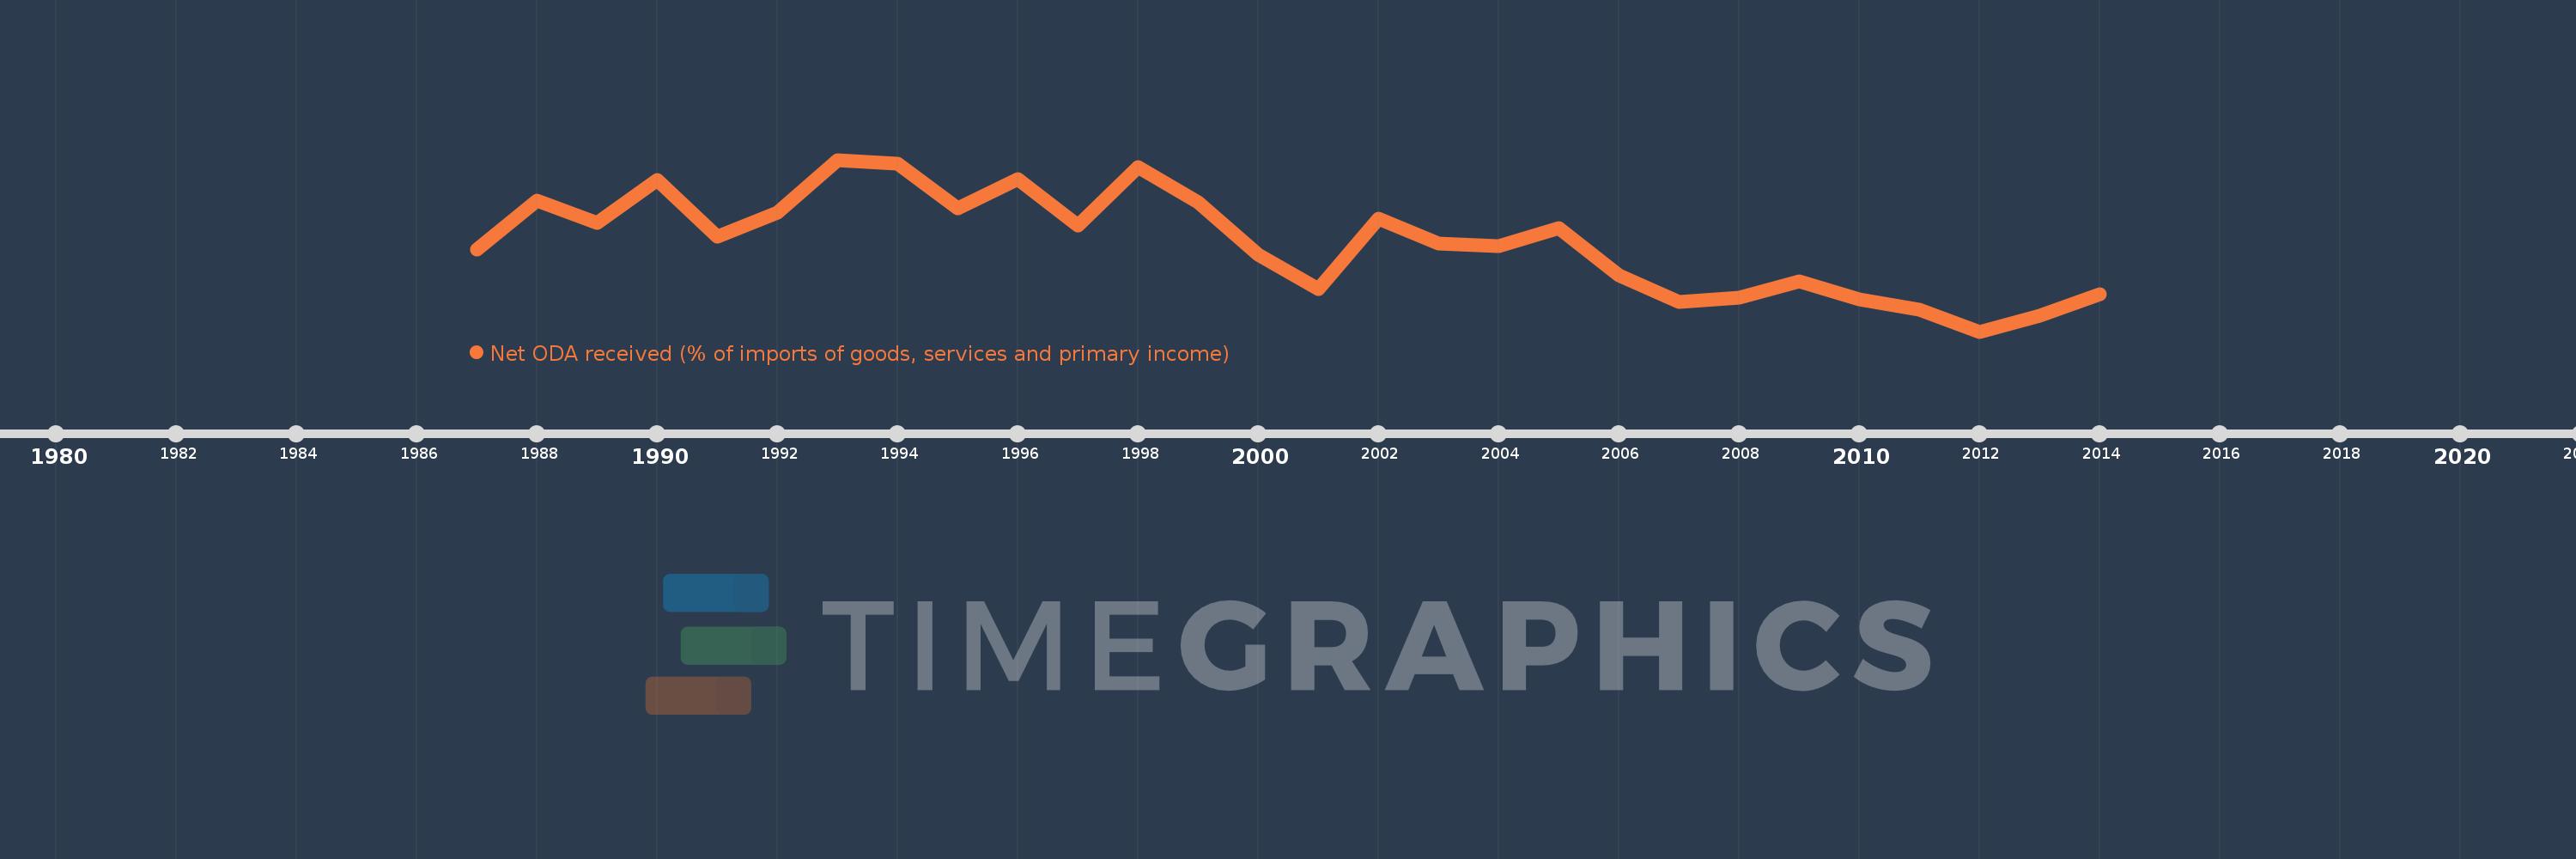
Net ODA received (% of imports of goods, services and primary income)
2014,2013,2012,2011,2010,2009,2008,2007,2006,2005,2004,2003,2002,2001,2000,1999,1998,1997,1996,1995,1994,1993,1992,1991,1990,1989,1988,1987
This statistics in other country:
AfghanistanAlbaniaAlgeriaAngolaAntigua and BarbudaArab WorldArgentinaArmeniaArubaAzerbaijanBahamas, TheBahrainBangladeshBarbadosBelarusBelizeBeninBhutanBoliviaBosnia and HerzegovinaBotswanaBrazilBurkina FasoBurundiCabo VerdeCambodiaCameroonCaribbean small statesCentral African RepublicCentral Europe and the BalticsChadChileChinaColombiaComorosCongo, Dem. Rep.Congo, Rep.Costa RicaCote d'IvoireCroatiaCyprusDjiboutiDominicaDominican RepublicEast Asia & PacificEast Asia & Pacific (excluding high income)East Asia & Pacific (IDA & IBRD countries)EcuadorEgypt, Arab Rep.El SalvadorEquatorial GuineaEritreaEthiopiaEuro areaEurope & Central AsiaEurope & Central Asia (excluding high income)Europe & Central Asia (IDA & IBRD countries)European UnionFijiFragile and conflict affected situationsGabonGambia, TheGeorgiaGhanaGrenadaGuatemalaGuineaGuinea-BissauGuyanaHaitiHeavily indebted poor countries (HIPC)High incomeHondurasIBRD onlyIDA & IBRD totalIDA blendIDA onlyIDA totalIndiaIndonesiaIran, Islamic Rep.IraqIsraelJamaicaJordanKazakhstanKenyaKiribatiKorea, Rep.KosovoKuwaitKyrgyz RepublicLao PDRLatin America & Caribbean Latin America & Caribbean (excluding high income)Latin America & the Caribbean (IDA & IBRD countries)Least developed countries: UN classificationLebanonLesothoLiberiaLibyaLow & middle incomeLow incomeLower middle incomeMacedonia, FYRMadagascarMalawiMalaysiaMaldivesMaliMaltaMarshall IslandsMauritaniaMauritiusMexicoMicronesia, Fed. Sts.Middle East & North Africa (excluding high income)Middle East & North Africa (IDA & IBRD countries)Middle incomeMoldovaMongoliaMontenegroMoroccoMozambiqueMyanmarNamibiaNepalNicaraguaNigerNigeriaNorth AmericaOECD membersOmanOther small statesPacific island small statesPakistanPalauPanamaPapua New GuineaParaguayPeruPhilippinesRwandaSamoaSao Tome and PrincipeSaudi ArabiaSenegalSerbiaSeychellesSierra LeoneSingaporeSloveniaSmall statesSolomon IslandsSouth AfricaSouth AsiaSouth Asia (IDA & IBRD)South SudanSri LankaSt. Kitts and NevisSt. LuciaSt. Vincent and the GrenadinesSub-Saharan Africa Sub-Saharan Africa (excluding high income)Sub-Saharan Africa (IDA & IBRD countries)SudanSurinameSwazilandSyrian Arab RepublicTajikistanTanzaniaThailandTimor-LesteTogoTongaTrinidad and TobagoTunisiaTurkeyTuvaluUgandaUkraineUpper middle incomeUruguayVanuatuVenezuela, RBVietnamWest Bank and GazaWorldYemen, Rep.ZambiaZimbabwe Timeline:
This timeline shows a graph from 1987 to 2014 of Guinea. No data until 1986. Number of actual observations by date: 28.
Source name:
World Development Indicators
Source organization:
Development Assistance Committee of the Organisation for Economic Co-operation and Development, Geographical Distribution of Financial Flows to Developing Countries, Development Co-operation Report, and International Development Statistics database. Data are available online at: www.oecd.org/dac/stats/idsonline. World Bank imports of good and services estimates are used for the denominator.
Categories, topics:
Aid Effectiveness
Last updated:
apr 23, 2017
Indicators value changes by year
Maximum:
41.424
jan 1, 1993
At the date of observation
Value
Absolute change
Change from previous value
jan 1, 1987
23.481
+23.481
0.0%
jan 1, 1988
33.303
+9.822
41.83%
jan 1, 1989
28.848
-4.456
-13.38%
jan 1, 1990
37.448
+8.601
29.81%
jan 1, 1991
26.162
-11.286
-30.14%
jan 1, 1992
30.841
+4.679
17.88%
jan 1, 1993
41.424
+10.583
34.31%
jan 1, 1994
40.622
-0.802
-1.94%
jan 1, 1995
31.67
-8.952
-22.04%
jan 1, 1996
37.519
+5.848
18.47%
jan 1, 1997
28.3
-9.219
-24.57%
jan 1, 1998
39.907
+11.607
41.02%
jan 1, 1999
33.024
-6.883
-17.25%
jan 1, 2000
22.569
-10.455
-31.66%
jan 1, 2001
15.719
-6.849
-30.35%
jan 1, 2002
29.786
+14.067
89.49%
jan 1, 2003
24.736
-5.05
-16.95%
jan 1, 2004
24.25
-0.486
-1.96%
jan 1, 2005
27.833
+3.582
14.77%
jan 1, 2006
18.364
-9.469
-34.02%
jan 1, 2007
13.061
-5.304
-28.88%
jan 1, 2008
13.93
+0.87
6.66%
jan 1, 2009
17.175
+3.245
23.3%
jan 1, 2010
13.555
-3.62
-21.08%
jan 1, 2011
11.508
-2.047
-15.1%
jan 1, 2012
7.198
-4.31
-37.45%
jan 1, 2013
10.325
+3.126
43.43%
jan 1, 2014
14.576
+4.251
41.17%
Ranking of countries by current statistics by years


Comments: