29
/
en
AIzaSyAYiBZKx7MnpbEhh9jyipgxe19OcubqV5w
April 1, 2024
280135
Vanuatu
VUT
true
2
1
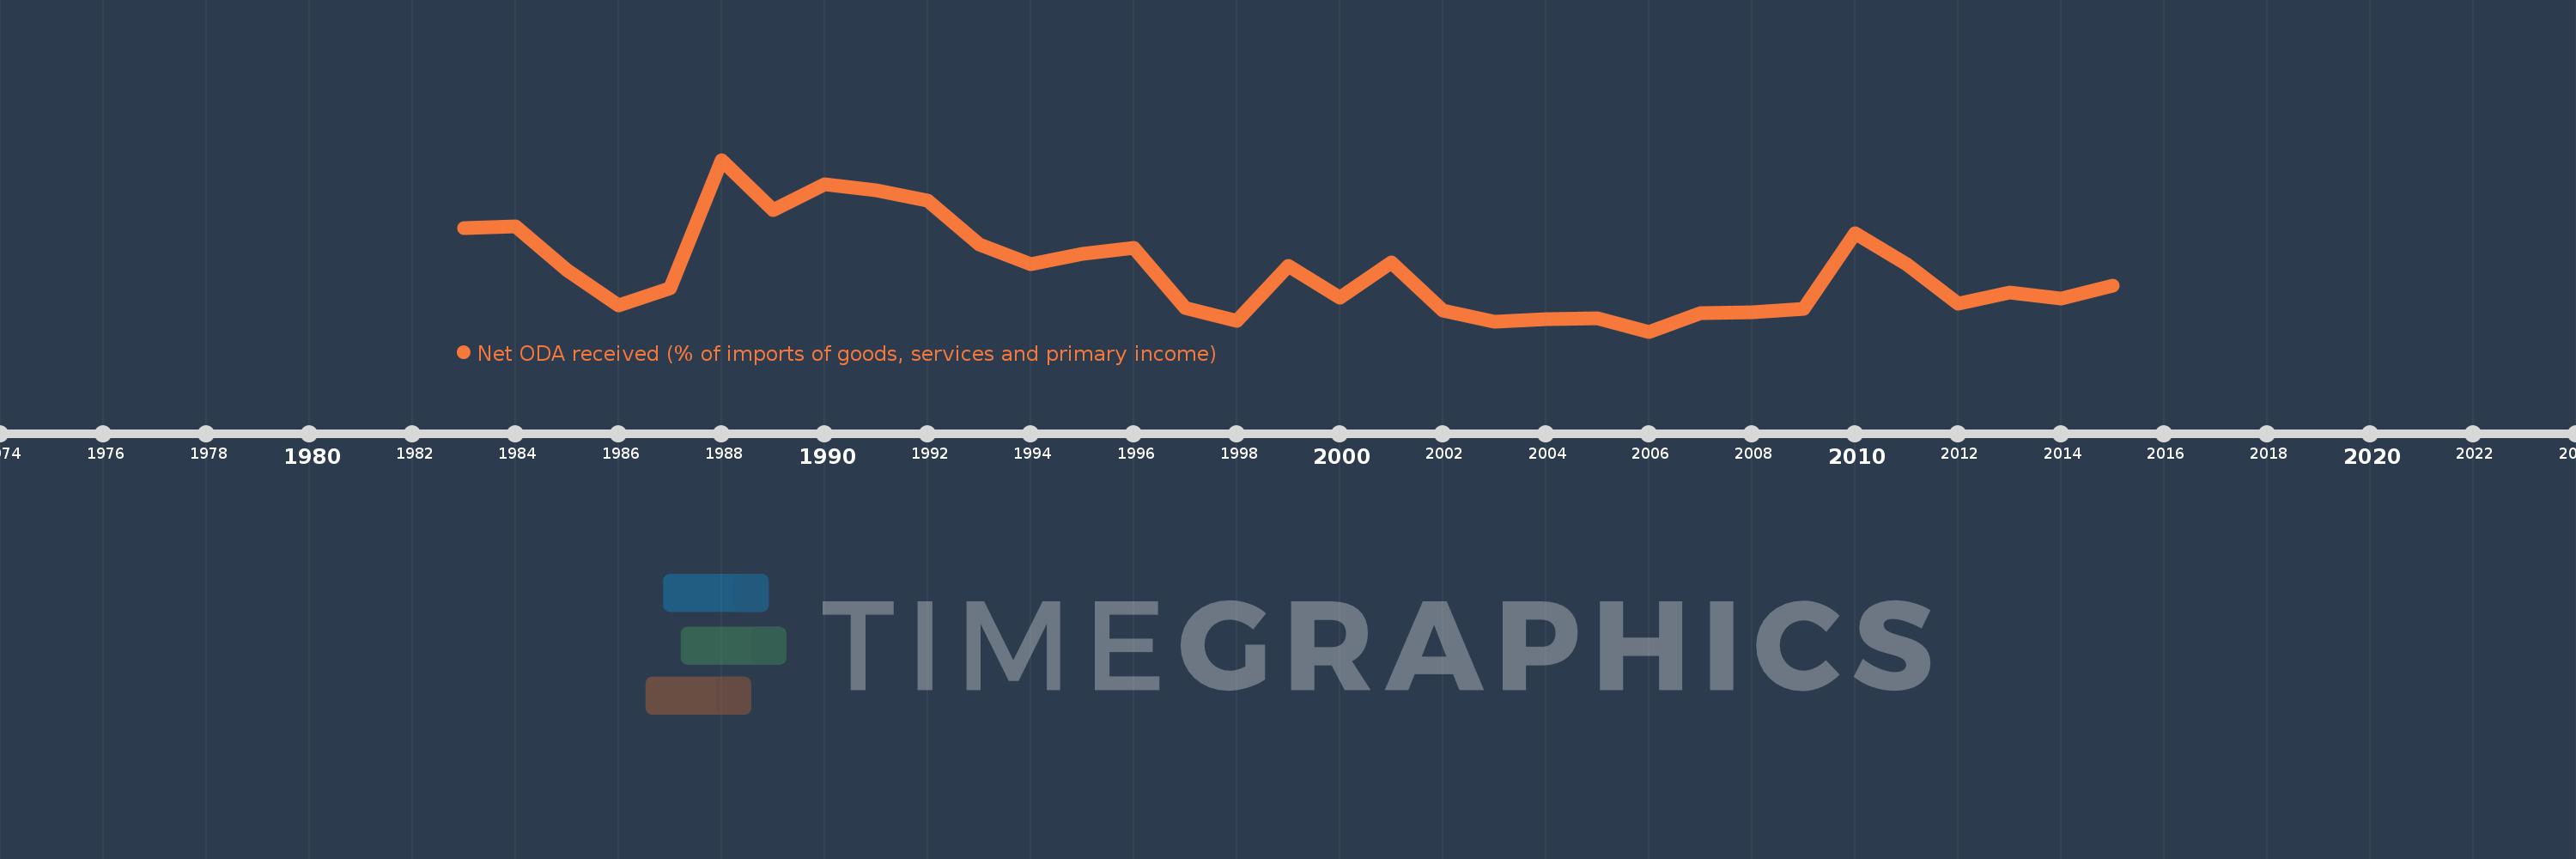
Net ODA received (% of imports of goods, services and primary income)
2015,2014,2013,2012,2011,2010,2009,2008,2007,2006,2005,2004,2003,2002,2001,2000,1999,1998,1997,1996,1995,1994,1993,1992,1991,1990,1989,1988,1987,1986,1985,1984,1983
This statistics in other country:
AfghanistanAlbaniaAlgeriaAngolaAntigua and BarbudaArab WorldArgentinaArmeniaArubaAzerbaijanBahamas, TheBahrainBangladeshBarbadosBelarusBelizeBeninBhutanBoliviaBosnia and HerzegovinaBotswanaBrazilBurkina FasoBurundiCabo VerdeCambodiaCameroonCaribbean small statesCentral African RepublicCentral Europe and the BalticsChadChileChinaColombiaComorosCongo, Dem. Rep.Congo, Rep.Costa RicaCote d'IvoireCroatiaCyprusDjiboutiDominicaDominican RepublicEast Asia & PacificEast Asia & Pacific (excluding high income)East Asia & Pacific (IDA & IBRD countries)EcuadorEgypt, Arab Rep.El SalvadorEquatorial GuineaEritreaEthiopiaEuro areaEurope & Central AsiaEurope & Central Asia (excluding high income)Europe & Central Asia (IDA & IBRD countries)European UnionFijiFragile and conflict affected situationsGabonGambia, TheGeorgiaGhanaGrenadaGuatemalaGuineaGuinea-BissauGuyanaHaitiHeavily indebted poor countries (HIPC)High incomeHondurasIBRD onlyIDA & IBRD totalIDA blendIDA onlyIDA totalIndiaIndonesiaIran, Islamic Rep.IraqIsraelJamaicaJordanKazakhstanKenyaKiribatiKorea, Rep.KosovoKuwaitKyrgyz RepublicLao PDRLatin America & Caribbean Latin America & Caribbean (excluding high income)Latin America & the Caribbean (IDA & IBRD countries)Least developed countries: UN classificationLebanonLesothoLiberiaLibyaLow & middle incomeLow incomeLower middle incomeMacedonia, FYRMadagascarMalawiMalaysiaMaldivesMaliMaltaMarshall IslandsMauritaniaMauritiusMexicoMicronesia, Fed. Sts.Middle East & North Africa (excluding high income)Middle East & North Africa (IDA & IBRD countries)Middle incomeMoldovaMongoliaMontenegroMoroccoMozambiqueMyanmarNamibiaNepalNicaraguaNigerNigeriaNorth AmericaOECD membersOmanOther small statesPacific island small statesPakistanPalauPanamaPapua New GuineaParaguayPeruPhilippinesRwandaSamoaSao Tome and PrincipeSaudi ArabiaSenegalSerbiaSeychellesSierra LeoneSingaporeSloveniaSmall statesSolomon IslandsSouth AfricaSouth AsiaSouth Asia (IDA & IBRD)South SudanSri LankaSt. Kitts and NevisSt. LuciaSt. Vincent and the GrenadinesSub-Saharan Africa Sub-Saharan Africa (excluding high income)Sub-Saharan Africa (IDA & IBRD countries)SudanSurinameSwazilandSyrian Arab RepublicTajikistanTanzaniaThailandTimor-LesteTogoTongaTrinidad and TobagoTunisiaTurkeyTuvaluUgandaUkraineUpper middle incomeUruguayVanuatuVenezuela, RBVietnamWest Bank and GazaWorldYemen, Rep.ZambiaZimbabwe Timeline:
This timeline shows a graph from 1983 to 2015 of Vanuatu. No data until 1982. Number of actual observations by date: 33.
Source name:
World Development Indicators
Source organization:
Development Assistance Committee of the Organisation for Economic Co-operation and Development, Geographical Distribution of Financial Flows to Developing Countries, Development Co-operation Report, and International Development Statistics database. Data are available online at: www.oecd.org/dac/stats/idsonline. World Bank imports of good and services estimates are used for the denominator.
Categories, topics:
Aid Effectiveness
Last updated:
apr 23, 2017
Indicators value changes by year
Minimum:
15.269
jan 1, 2006
Maximum:
40.863
jan 1, 1988
At the date of observation
Value
Absolute change
Change from previous value
jan 1, 1983
30.678
+30.678
0.0%
jan 1, 1984
31.003
+0.325
1.06%
jan 1, 1985
24.403
-6.6
-21.29%
jan 1, 1986
19.163
-5.241
-21.48%
jan 1, 1987
21.753
+2.59
13.52%
jan 1, 1988
40.863
+19.11
87.85%
jan 1, 1989
33.369
-7.494
-18.34%
jan 1, 1990
37.198
+3.829
11.47%
jan 1, 1991
36.281
-0.917
-2.47%
jan 1, 1992
34.794
-1.486
-4.1%
jan 1, 1993
28.222
-6.573
-18.89%
jan 1, 1994
25.319
-2.903
-10.28%
jan 1, 1995
26.832
+1.513
5.98%
jan 1, 1996
27.709
+0.876
3.27%
jan 1, 1997
18.813
-8.896
-32.11%
jan 1, 1998
16.908
-1.904
-10.12%
jan 1, 1999
25.016
+8.108
47.95%
jan 1, 2000
20.373
-4.643
-18.56%
jan 1, 2001
25.616
+5.243
25.73%
jan 1, 2002
18.416
-7.2
-28.11%
jan 1, 2003
16.757
-1.659
-9.01%
jan 1, 2004
17.174
+0.417
2.49%
jan 1, 2005
17.261
+0.087
0.51%
jan 1, 2006
15.269
-1.992
-11.54%
jan 1, 2007
18.022
+2.753
18.03%
jan 1, 2008
18.102
+0.081
0.45%
jan 1, 2009
18.724
+0.621
3.43%
jan 1, 2010
29.867
+11.143
59.51%
jan 1, 2011
25.326
-4.541
-15.2%
jan 1, 2012
19.439
-5.887
-23.24%
jan 1, 2013
21.152
+1.713
8.81%
jan 1, 2014
20.178
-0.974
-4.61%
jan 1, 2015
22.072
+1.895
9.39%
Ranking of countries by current statistics by years


Comments: