29
/
en
AIzaSyAYiBZKx7MnpbEhh9jyipgxe19OcubqV5w
April 1, 2024
125202
Egypt, Arab Rep.
EGY
true
2
1
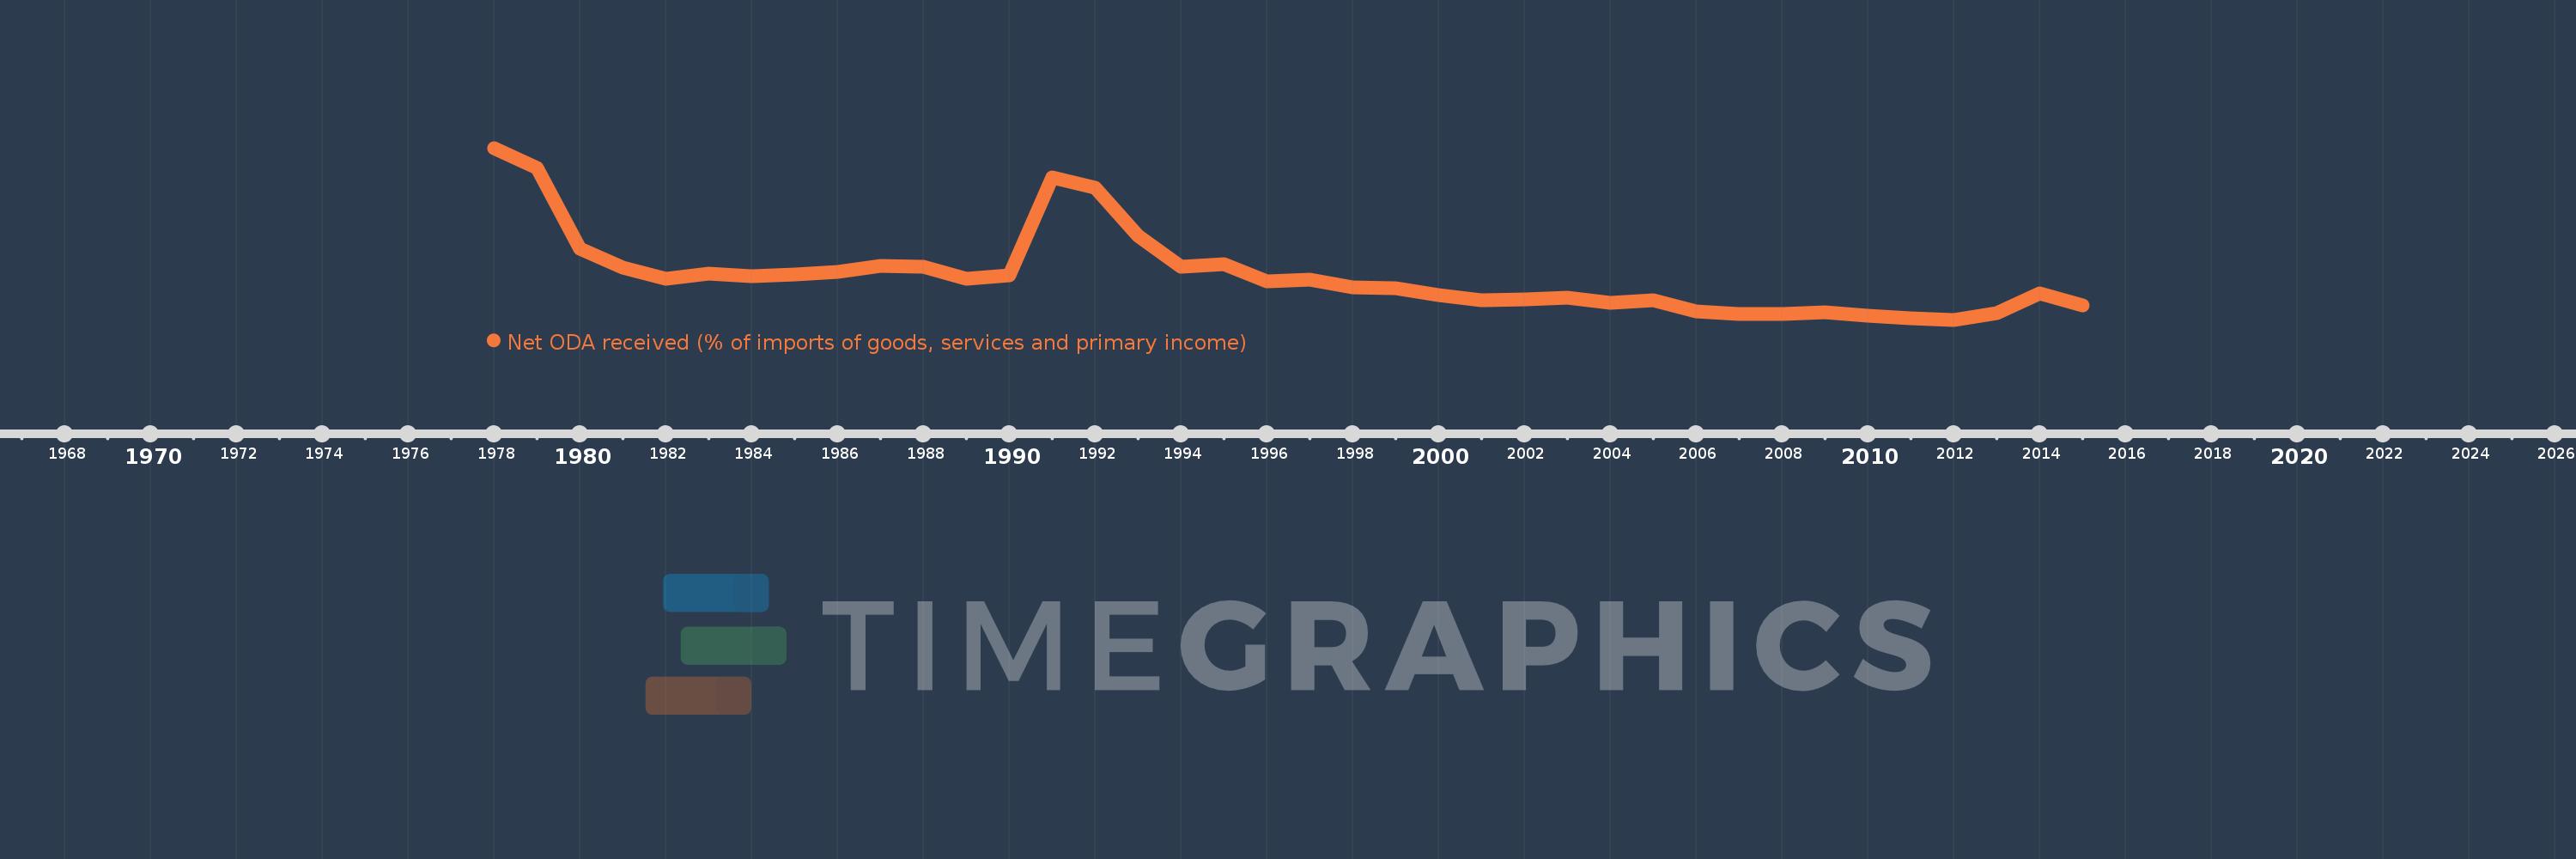
Net ODA received (% of imports of goods, services and primary income)
2015,2014,2013,2012,2011,2010,2009,2008,2007,2006,2005,2004,2003,2002,2001,2000,1999,1998,1997,1996,1995,1994,1993,1992,1991,1990,1989,1988,1987,1986,1985,1984,1983,1982,1981,1980,1979,1978
This statistics in other country:
AfghanistanAlbaniaAlgeriaAngolaAntigua and BarbudaArab WorldArgentinaArmeniaArubaAzerbaijanBahamas, TheBahrainBangladeshBarbadosBelarusBelizeBeninBhutanBoliviaBosnia and HerzegovinaBotswanaBrazilBurkina FasoBurundiCabo VerdeCambodiaCameroonCaribbean small statesCentral African RepublicCentral Europe and the BalticsChadChileChinaColombiaComorosCongo, Dem. Rep.Congo, Rep.Costa RicaCote d'IvoireCroatiaCyprusDjiboutiDominicaDominican RepublicEast Asia & PacificEast Asia & Pacific (excluding high income)East Asia & Pacific (IDA & IBRD countries)EcuadorEgypt, Arab Rep.El SalvadorEquatorial GuineaEritreaEthiopiaEuro areaEurope & Central AsiaEurope & Central Asia (excluding high income)Europe & Central Asia (IDA & IBRD countries)European UnionFijiFragile and conflict affected situationsGabonGambia, TheGeorgiaGhanaGrenadaGuatemalaGuineaGuinea-BissauGuyanaHaitiHeavily indebted poor countries (HIPC)High incomeHondurasIBRD onlyIDA & IBRD totalIDA blendIDA onlyIDA totalIndiaIndonesiaIran, Islamic Rep.IraqIsraelJamaicaJordanKazakhstanKenyaKiribatiKorea, Rep.KosovoKuwaitKyrgyz RepublicLao PDRLatin America & Caribbean Latin America & Caribbean (excluding high income)Latin America & the Caribbean (IDA & IBRD countries)Least developed countries: UN classificationLebanonLesothoLiberiaLibyaLow & middle incomeLow incomeLower middle incomeMacedonia, FYRMadagascarMalawiMalaysiaMaldivesMaliMaltaMarshall IslandsMauritaniaMauritiusMexicoMicronesia, Fed. Sts.Middle East & North Africa (excluding high income)Middle East & North Africa (IDA & IBRD countries)Middle incomeMoldovaMongoliaMontenegroMoroccoMozambiqueMyanmarNamibiaNepalNicaraguaNigerNigeriaNorth AmericaOECD membersOmanOther small statesPacific island small statesPakistanPalauPanamaPapua New GuineaParaguayPeruPhilippinesRwandaSamoaSao Tome and PrincipeSaudi ArabiaSenegalSerbiaSeychellesSierra LeoneSingaporeSloveniaSmall statesSolomon IslandsSouth AfricaSouth AsiaSouth Asia (IDA & IBRD)South SudanSri LankaSt. Kitts and NevisSt. LuciaSt. Vincent and the GrenadinesSub-Saharan Africa Sub-Saharan Africa (excluding high income)Sub-Saharan Africa (IDA & IBRD countries)SudanSurinameSwazilandSyrian Arab RepublicTajikistanTanzaniaThailandTimor-LesteTogoTongaTrinidad and TobagoTunisiaTurkeyTuvaluUgandaUkraineUpper middle incomeUruguayVanuatuVenezuela, RBVietnamWest Bank and GazaWorldYemen, Rep.ZambiaZimbabwe Timeline:
This timeline shows a graph from 1978 to 2015 of Egypt, Arab Rep.. No data until 1977. Number of actual observations by date: 38.
Source name:
World Development Indicators
Source organization:
Development Assistance Committee of the Organisation for Economic Co-operation and Development, Geographical Distribution of Financial Flows to Developing Countries, Development Co-operation Report, and International Development Statistics database. Data are available online at: www.oecd.org/dac/stats/idsonline. World Bank imports of good and services estimates are used for the denominator.
Categories, topics:
Aid Effectiveness
Last updated:
apr 23, 2017
Indicators value changes by year
Maximum:
45.648
jan 1, 1978
At the date of observation
Value
Absolute change
Change from previous value
jan 1, 1978
45.648
+45.648
0.0%
jan 1, 1979
40.346
-5.301
-11.61%
jan 1, 1980
19.26
-21.087
-52.26%
jan 1, 1981
14.226
-5.034
-26.14%
jan 1, 1982
11.463
-2.763
-19.42%
jan 1, 1983
12.675
+1.213
10.58%
jan 1, 1984
12.013
-0.663
-5.23%
jan 1, 1985
12.408
+0.395
3.29%
jan 1, 1986
13.254
+0.846
6.82%
jan 1, 1987
14.784
+1.53
11.54%
jan 1, 1988
14.584
-0.2
-1.35%
jan 1, 1989
11.365
-3.219
-22.07%
jan 1, 1990
12.162
+0.797
7.01%
jan 1, 1991
37.929
+25.767
211.87%
jan 1, 1992
35.275
-2.654
-7.0%
jan 1, 1993
22.592
-12.683
-35.95%
jan 1, 1994
14.411
-8.181
-36.21%
jan 1, 1995
15.178
+0.766
5.32%
jan 1, 1996
10.615
-4.563
-30.06%
jan 1, 1997
11.076
+0.461
4.34%
jan 1, 1998
9.119
-1.957
-17.67%
jan 1, 1999
8.882
-0.237
-2.6%
jan 1, 2000
7.171
-1.711
-19.26%
jan 1, 2001
5.742
-1.429
-19.92%
jan 1, 2002
5.979
+0.236
4.12%
jan 1, 2003
6.439
+0.46
7.69%
jan 1, 2004
4.979
-1.46
-22.68%
jan 1, 2005
5.612
+0.633
12.72%
jan 1, 2006
2.896
-2.716
-48.39%
jan 1, 2007
2.121
-0.775
-26.77%
jan 1, 2008
2.037
-0.084
-3.97%
jan 1, 2009
2.525
+0.488
23.98%
jan 1, 2010
1.757
-0.768
-30.41%
jan 1, 2011
0.888
-0.869
-49.44%
jan 1, 2012
0.612
-0.277
-31.15%
jan 1, 2013
2.39
+1.778
290.71%
jan 1, 2014
7.578
+5.188
217.08%
jan 1, 2015
4.365
-3.214
-42.41%
Ranking of countries by current statistics by years


Comments: