29
/
en
AIzaSyAYiBZKx7MnpbEhh9jyipgxe19OcubqV5w
April 1, 2024
167887
Kenya
KEN
true
2
1
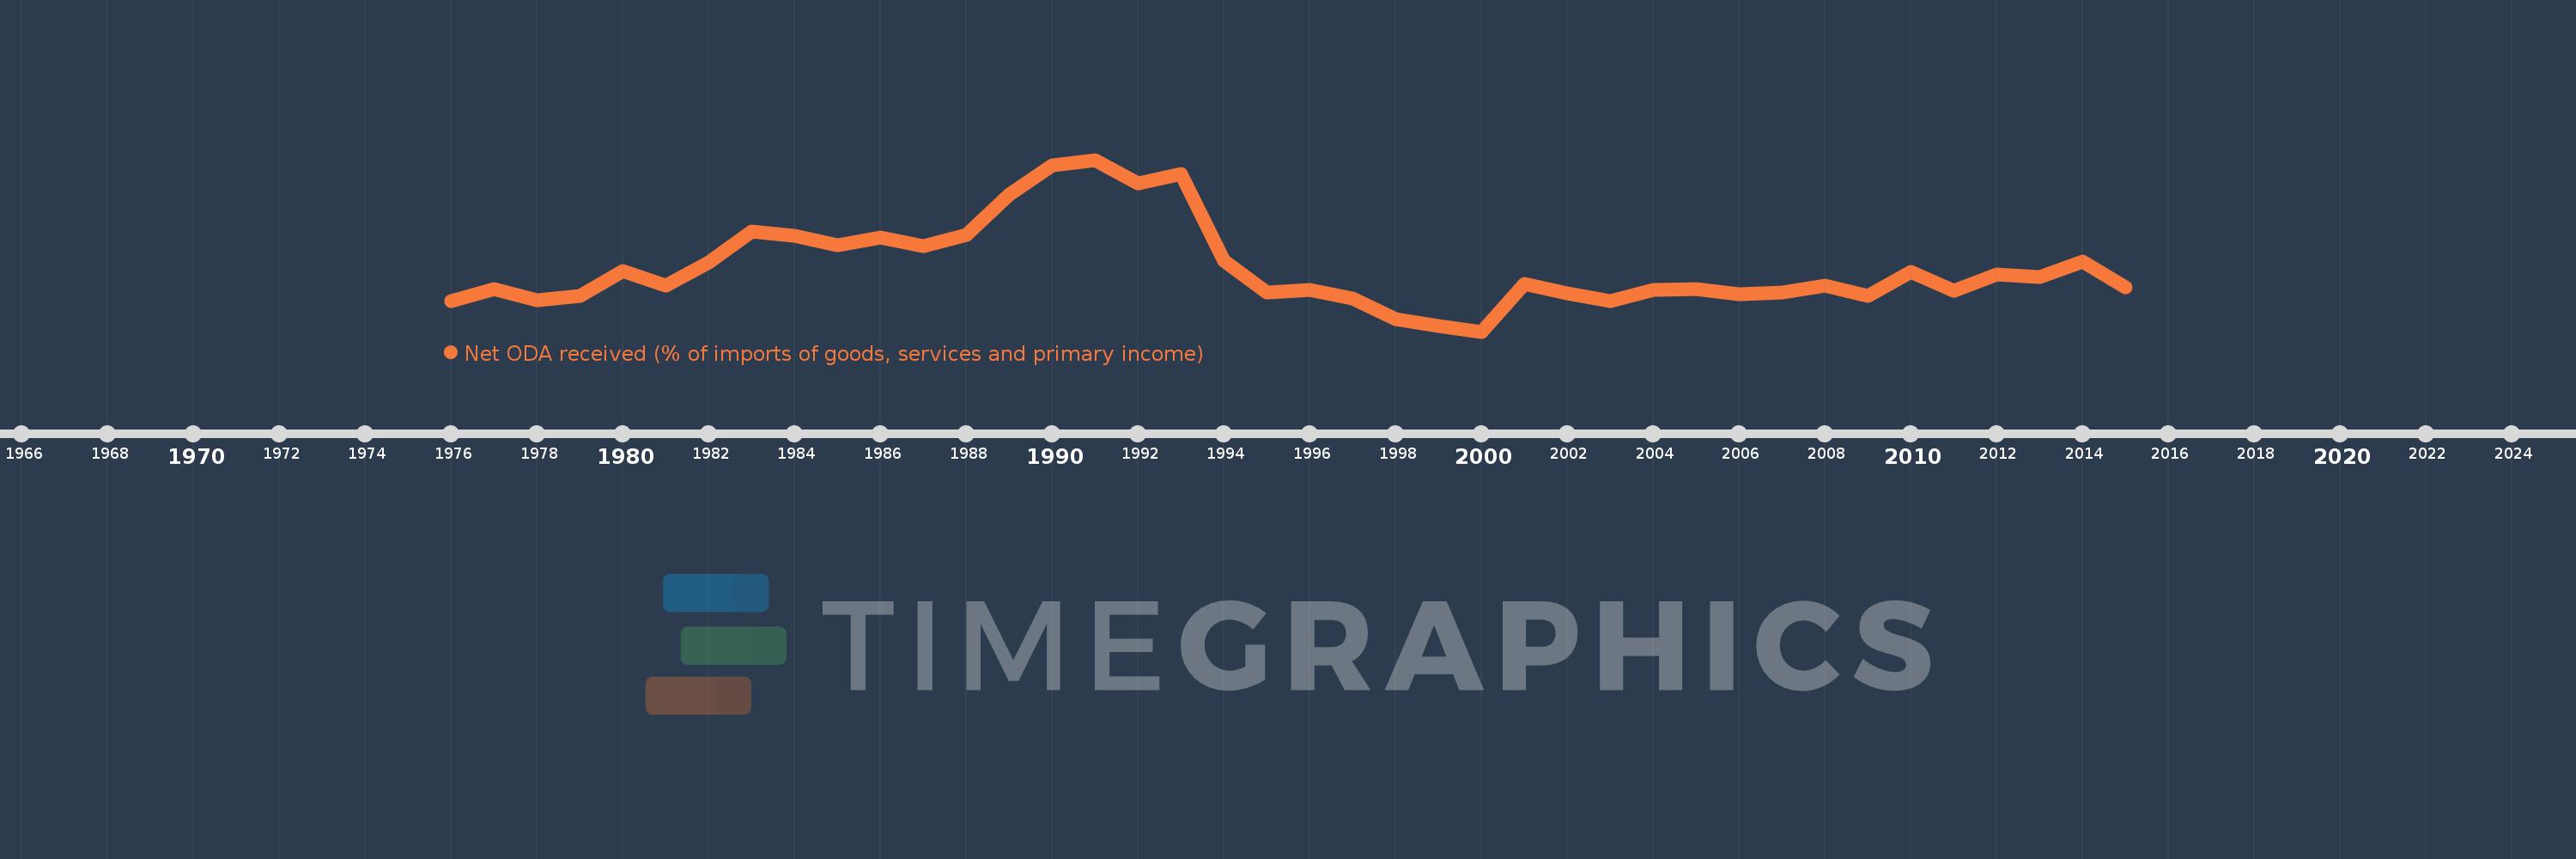
Net ODA received (% of imports of goods, services and primary income)
2015,2014,2013,2012,2011,2010,2009,2008,2007,2006,2005,2004,2003,2002,2001,2000,1999,1998,1997,1996,1995,1994,1993,1992,1991,1990,1989,1988,1987,1986,1985,1984,1983,1982,1981,1980,1979,1978,1977,1976
This statistics in other country:
AfghanistanAlbaniaAlgeriaAngolaAntigua and BarbudaArab WorldArgentinaArmeniaArubaAzerbaijanBahamas, TheBahrainBangladeshBarbadosBelarusBelizeBeninBhutanBoliviaBosnia and HerzegovinaBotswanaBrazilBurkina FasoBurundiCabo VerdeCambodiaCameroonCaribbean small statesCentral African RepublicCentral Europe and the BalticsChadChileChinaColombiaComorosCongo, Dem. Rep.Congo, Rep.Costa RicaCote d'IvoireCroatiaCyprusDjiboutiDominicaDominican RepublicEast Asia & PacificEast Asia & Pacific (excluding high income)East Asia & Pacific (IDA & IBRD countries)EcuadorEgypt, Arab Rep.El SalvadorEquatorial GuineaEritreaEthiopiaEuro areaEurope & Central AsiaEurope & Central Asia (excluding high income)Europe & Central Asia (IDA & IBRD countries)European UnionFijiFragile and conflict affected situationsGabonGambia, TheGeorgiaGhanaGrenadaGuatemalaGuineaGuinea-BissauGuyanaHaitiHeavily indebted poor countries (HIPC)High incomeHondurasIBRD onlyIDA & IBRD totalIDA blendIDA onlyIDA totalIndiaIndonesiaIran, Islamic Rep.IraqIsraelJamaicaJordanKazakhstanKenyaKiribatiKorea, Rep.KosovoKuwaitKyrgyz RepublicLao PDRLatin America & Caribbean Latin America & Caribbean (excluding high income)Latin America & the Caribbean (IDA & IBRD countries)Least developed countries: UN classificationLebanonLesothoLiberiaLibyaLow & middle incomeLow incomeLower middle incomeMacedonia, FYRMadagascarMalawiMalaysiaMaldivesMaliMaltaMarshall IslandsMauritaniaMauritiusMexicoMicronesia, Fed. Sts.Middle East & North Africa (excluding high income)Middle East & North Africa (IDA & IBRD countries)Middle incomeMoldovaMongoliaMontenegroMoroccoMozambiqueMyanmarNamibiaNepalNicaraguaNigerNigeriaNorth AmericaOECD membersOmanOther small statesPacific island small statesPakistanPalauPanamaPapua New GuineaParaguayPeruPhilippinesRwandaSamoaSao Tome and PrincipeSaudi ArabiaSenegalSerbiaSeychellesSierra LeoneSingaporeSloveniaSmall statesSolomon IslandsSouth AfricaSouth AsiaSouth Asia (IDA & IBRD)South SudanSri LankaSt. Kitts and NevisSt. LuciaSt. Vincent and the GrenadinesSub-Saharan Africa Sub-Saharan Africa (excluding high income)Sub-Saharan Africa (IDA & IBRD countries)SudanSurinameSwazilandSyrian Arab RepublicTajikistanTanzaniaThailandTimor-LesteTogoTongaTrinidad and TobagoTunisiaTurkeyTuvaluUgandaUkraineUpper middle incomeUruguayVanuatuVenezuela, RBVietnamWest Bank and GazaWorldYemen, Rep.ZambiaZimbabwe Timeline:
This timeline shows a graph from 1976 to 2015 of Kenya. No data until 1975. Number of actual observations by date: 40.
Source name:
World Development Indicators
Source organization:
Development Assistance Committee of the Organisation for Economic Co-operation and Development, Geographical Distribution of Financial Flows to Developing Countries, Development Co-operation Report, and International Development Statistics database. Data are available online at: www.oecd.org/dac/stats/idsonline. World Bank imports of good and services estimates are used for the denominator.
Categories, topics:
Aid Effectiveness
Last updated:
apr 23, 2017
Indicators value changes by year
Maximum:
37.763
jan 1, 1991
At the date of observation
Value
Absolute change
Change from previous value
jan 1, 1976
9.752
+9.752
0.0%
jan 1, 1977
12.062
+2.31
23.69%
jan 1, 1978
9.846
-2.217
-18.38%
jan 1, 1979
10.701
+0.856
8.69%
jan 1, 1980
15.698
+4.996
46.69%
jan 1, 1981
12.757
-2.941
-18.73%
jan 1, 1982
17.403
+4.646
36.42%
jan 1, 1983
23.439
+6.035
34.68%
jan 1, 1984
22.6
-0.838
-3.58%
jan 1, 1985
20.774
-1.826
-8.08%
jan 1, 1986
22.325
+1.551
7.46%
jan 1, 1987
20.626
-1.699
-7.61%
jan 1, 1988
22.769
+2.143
10.39%
jan 1, 1989
30.842
+8.073
35.46%
jan 1, 1990
36.584
+5.741
18.61%
jan 1, 1991
37.763
+1.179
3.22%
jan 1, 1992
33.149
-4.614
-12.22%
jan 1, 1993
34.879
+1.731
5.22%
jan 1, 1994
17.668
-17.212
-49.35%
jan 1, 1995
11.45
-6.218
-35.19%
jan 1, 1996
11.814
+0.364
3.18%
jan 1, 1997
10.154
-1.659
-14.04%
jan 1, 1998
6.094
-4.061
-39.99%
jan 1, 1999
4.793
-1.3
-21.34%
jan 1, 2000
3.618
-1.175
-24.51%
jan 1, 2001
13.011
+9.393
259.58%
jan 1, 2002
11.177
-1.834
-14.1%
jan 1, 2003
9.709
-1.468
-13.13%
jan 1, 2004
11.866
+2.157
22.22%
jan 1, 2005
12.089
+0.223
1.88%
jan 1, 2006
10.97
-1.119
-9.26%
jan 1, 2007
11.351
+0.38
3.47%
jan 1, 2008
12.802
+1.451
12.79%
jan 1, 2009
10.688
-2.114
-16.51%
jan 1, 2010
15.426
+4.739
44.34%
jan 1, 2011
11.753
-3.673
-23.81%
jan 1, 2012
14.915
+3.162
26.91%
jan 1, 2013
14.521
-0.394
-2.64%
jan 1, 2014
17.467
+2.946
20.29%
jan 1, 2015
12.45
-5.018
-28.73%
Ranking of countries by current statistics by years


Comments: