29
/
en
AIzaSyAYiBZKx7MnpbEhh9jyipgxe19OcubqV5w
April 1, 2024
140787
Ghana
GHA
true
2
1
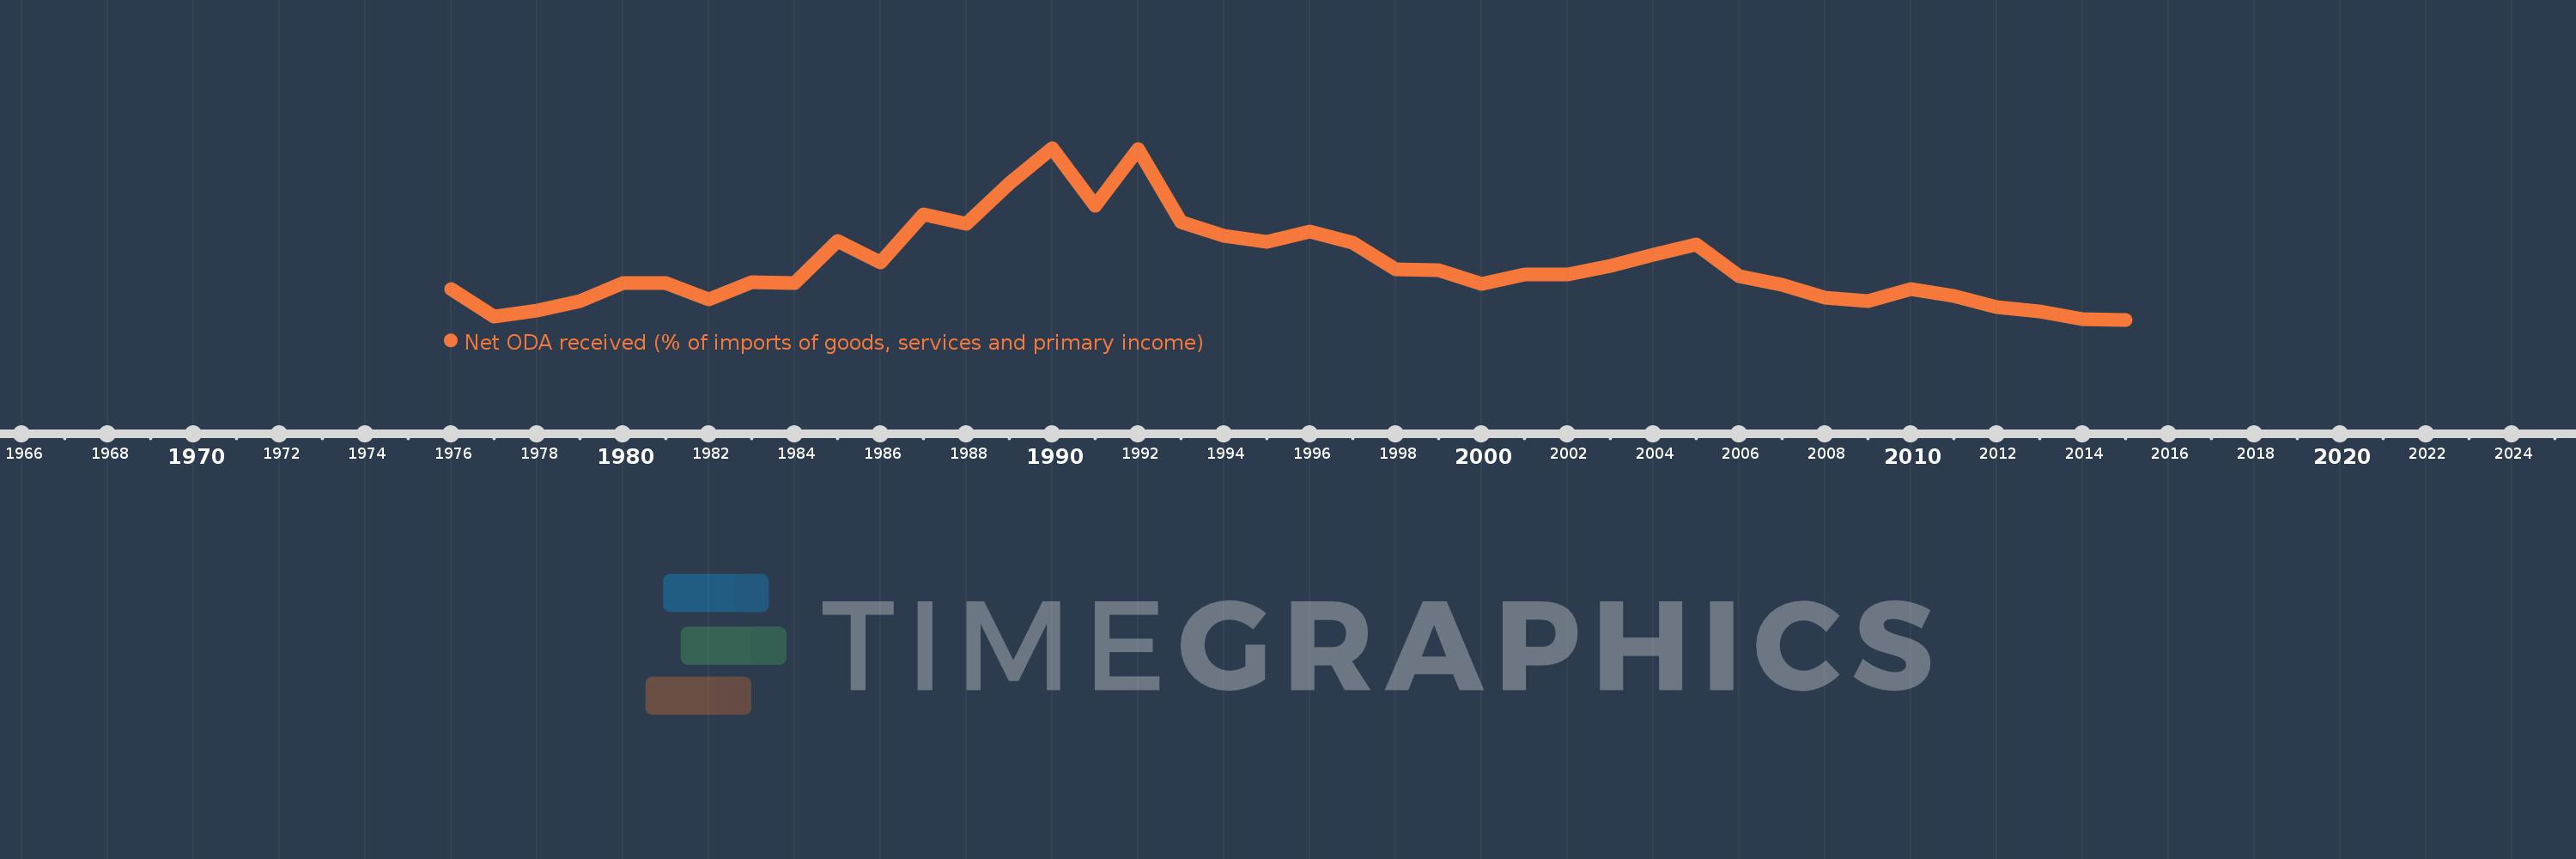
Net ODA received (% of imports of goods, services and primary income)
2015,2014,2013,2012,2011,2010,2009,2008,2007,2006,2005,2004,2003,2002,2001,2000,1999,1998,1997,1996,1995,1994,1993,1992,1991,1990,1989,1988,1987,1986,1985,1984,1983,1982,1981,1980,1979,1978,1977,1976
This statistics in other country:
AfghanistanAlbaniaAlgeriaAngolaAntigua and BarbudaArab WorldArgentinaArmeniaArubaAzerbaijanBahamas, TheBahrainBangladeshBarbadosBelarusBelizeBeninBhutanBoliviaBosnia and HerzegovinaBotswanaBrazilBurkina FasoBurundiCabo VerdeCambodiaCameroonCaribbean small statesCentral African RepublicCentral Europe and the BalticsChadChileChinaColombiaComorosCongo, Dem. Rep.Congo, Rep.Costa RicaCote d'IvoireCroatiaCyprusDjiboutiDominicaDominican RepublicEast Asia & PacificEast Asia & Pacific (excluding high income)East Asia & Pacific (IDA & IBRD countries)EcuadorEgypt, Arab Rep.El SalvadorEquatorial GuineaEritreaEthiopiaEuro areaEurope & Central AsiaEurope & Central Asia (excluding high income)Europe & Central Asia (IDA & IBRD countries)European UnionFijiFragile and conflict affected situationsGabonGambia, TheGeorgiaGhanaGrenadaGuatemalaGuineaGuinea-BissauGuyanaHaitiHeavily indebted poor countries (HIPC)High incomeHondurasIBRD onlyIDA & IBRD totalIDA blendIDA onlyIDA totalIndiaIndonesiaIran, Islamic Rep.IraqIsraelJamaicaJordanKazakhstanKenyaKiribatiKorea, Rep.KosovoKuwaitKyrgyz RepublicLao PDRLatin America & Caribbean Latin America & Caribbean (excluding high income)Latin America & the Caribbean (IDA & IBRD countries)Least developed countries: UN classificationLebanonLesothoLiberiaLibyaLow & middle incomeLow incomeLower middle incomeMacedonia, FYRMadagascarMalawiMalaysiaMaldivesMaliMaltaMarshall IslandsMauritaniaMauritiusMexicoMicronesia, Fed. Sts.Middle East & North Africa (excluding high income)Middle East & North Africa (IDA & IBRD countries)Middle incomeMoldovaMongoliaMontenegroMoroccoMozambiqueMyanmarNamibiaNepalNicaraguaNigerNigeriaNorth AmericaOECD membersOmanOther small statesPacific island small statesPakistanPalauPanamaPapua New GuineaParaguayPeruPhilippinesRwandaSamoaSao Tome and PrincipeSaudi ArabiaSenegalSerbiaSeychellesSierra LeoneSingaporeSloveniaSmall statesSolomon IslandsSouth AfricaSouth AsiaSouth Asia (IDA & IBRD)South SudanSri LankaSt. Kitts and NevisSt. LuciaSt. Vincent and the GrenadinesSub-Saharan Africa Sub-Saharan Africa (excluding high income)Sub-Saharan Africa (IDA & IBRD countries)SudanSurinameSwazilandSyrian Arab RepublicTajikistanTanzaniaThailandTimor-LesteTogoTongaTrinidad and TobagoTunisiaTurkeyTuvaluUgandaUkraineUpper middle incomeUruguayVanuatuVenezuela, RBVietnamWest Bank and GazaWorldYemen, Rep.ZambiaZimbabwe Timeline:
This timeline shows a graph from 1976 to 2015 of Ghana. No data until 1975. Number of actual observations by date: 40.
Source name:
World Development Indicators
Source organization:
Development Assistance Committee of the Organisation for Economic Co-operation and Development, Geographical Distribution of Financial Flows to Developing Countries, Development Co-operation Report, and International Development Statistics database. Data are available online at: www.oecd.org/dac/stats/idsonline. World Bank imports of good and services estimates are used for the denominator.
Categories, topics:
Aid Effectiveness
Last updated:
apr 23, 2017
Indicators value changes by year
At the date of observation
Value
Absolute change
Change from previous value
jan 1, 1976
13.467
+13.467
0.0%
jan 1, 1977
6.186
-7.281
-54.06%
jan 1, 1978
7.783
+1.597
25.81%
jan 1, 1979
10.184
+2.401
30.85%
jan 1, 1980
15.001
+4.817
47.3%
jan 1, 1981
15.102
+0.101
0.67%
jan 1, 1982
10.791
-4.311
-28.55%
jan 1, 1983
15.327
+4.536
42.04%
jan 1, 1984
14.97
-0.357
-2.33%
jan 1, 1985
26.22
+11.251
75.16%
jan 1, 1986
20.406
-5.814
-22.17%
jan 1, 1987
33.194
+12.788
62.67%
jan 1, 1988
30.804
-2.39
-7.2%
jan 1, 1989
41.311
+10.507
34.11%
jan 1, 1990
50.74
+9.428
22.82%
jan 1, 1991
35.369
-15.37
-30.29%
jan 1, 1992
50.341
+14.972
42.33%
jan 1, 1993
31.065
-19.277
-38.29%
jan 1, 1994
27.468
-3.597
-11.58%
jan 1, 1995
25.907
-1.56
-5.68%
jan 1, 1996
28.661
+2.754
10.63%
jan 1, 1997
25.595
-3.066
-10.7%
jan 1, 1998
18.662
-6.933
-27.09%
jan 1, 1999
18.394
-0.268
-1.44%
jan 1, 2000
14.923
-3.471
-18.87%
jan 1, 2001
17.221
+2.298
15.4%
jan 1, 2002
17.321
+0.099
0.58%
jan 1, 2003
19.511
+2.191
12.65%
jan 1, 2004
22.571
+3.06
15.68%
jan 1, 2005
25.237
+2.666
11.81%
jan 1, 2006
16.796
-8.441
-33.45%
jan 1, 2007
14.649
-2.148
-12.79%
jan 1, 2008
11.087
-3.562
-24.32%
jan 1, 2009
10.295
-0.792
-7.14%
jan 1, 2010
13.509
+3.214
31.22%
jan 1, 2011
11.608
-1.9
-14.07%
jan 1, 2012
8.659
-2.949
-25.41%
jan 1, 2013
7.437
-1.222
-14.12%
jan 1, 2014
5.511
-1.926
-25.9%
jan 1, 2015
5.345
-0.166
-3.02%
Ranking of countries by current statistics by years


Comments: