29
/
en
AIzaSyAYiBZKx7MnpbEhh9jyipgxe19OcubqV5w
April 1, 2024
53657
Other small states
OSS
false
2
1
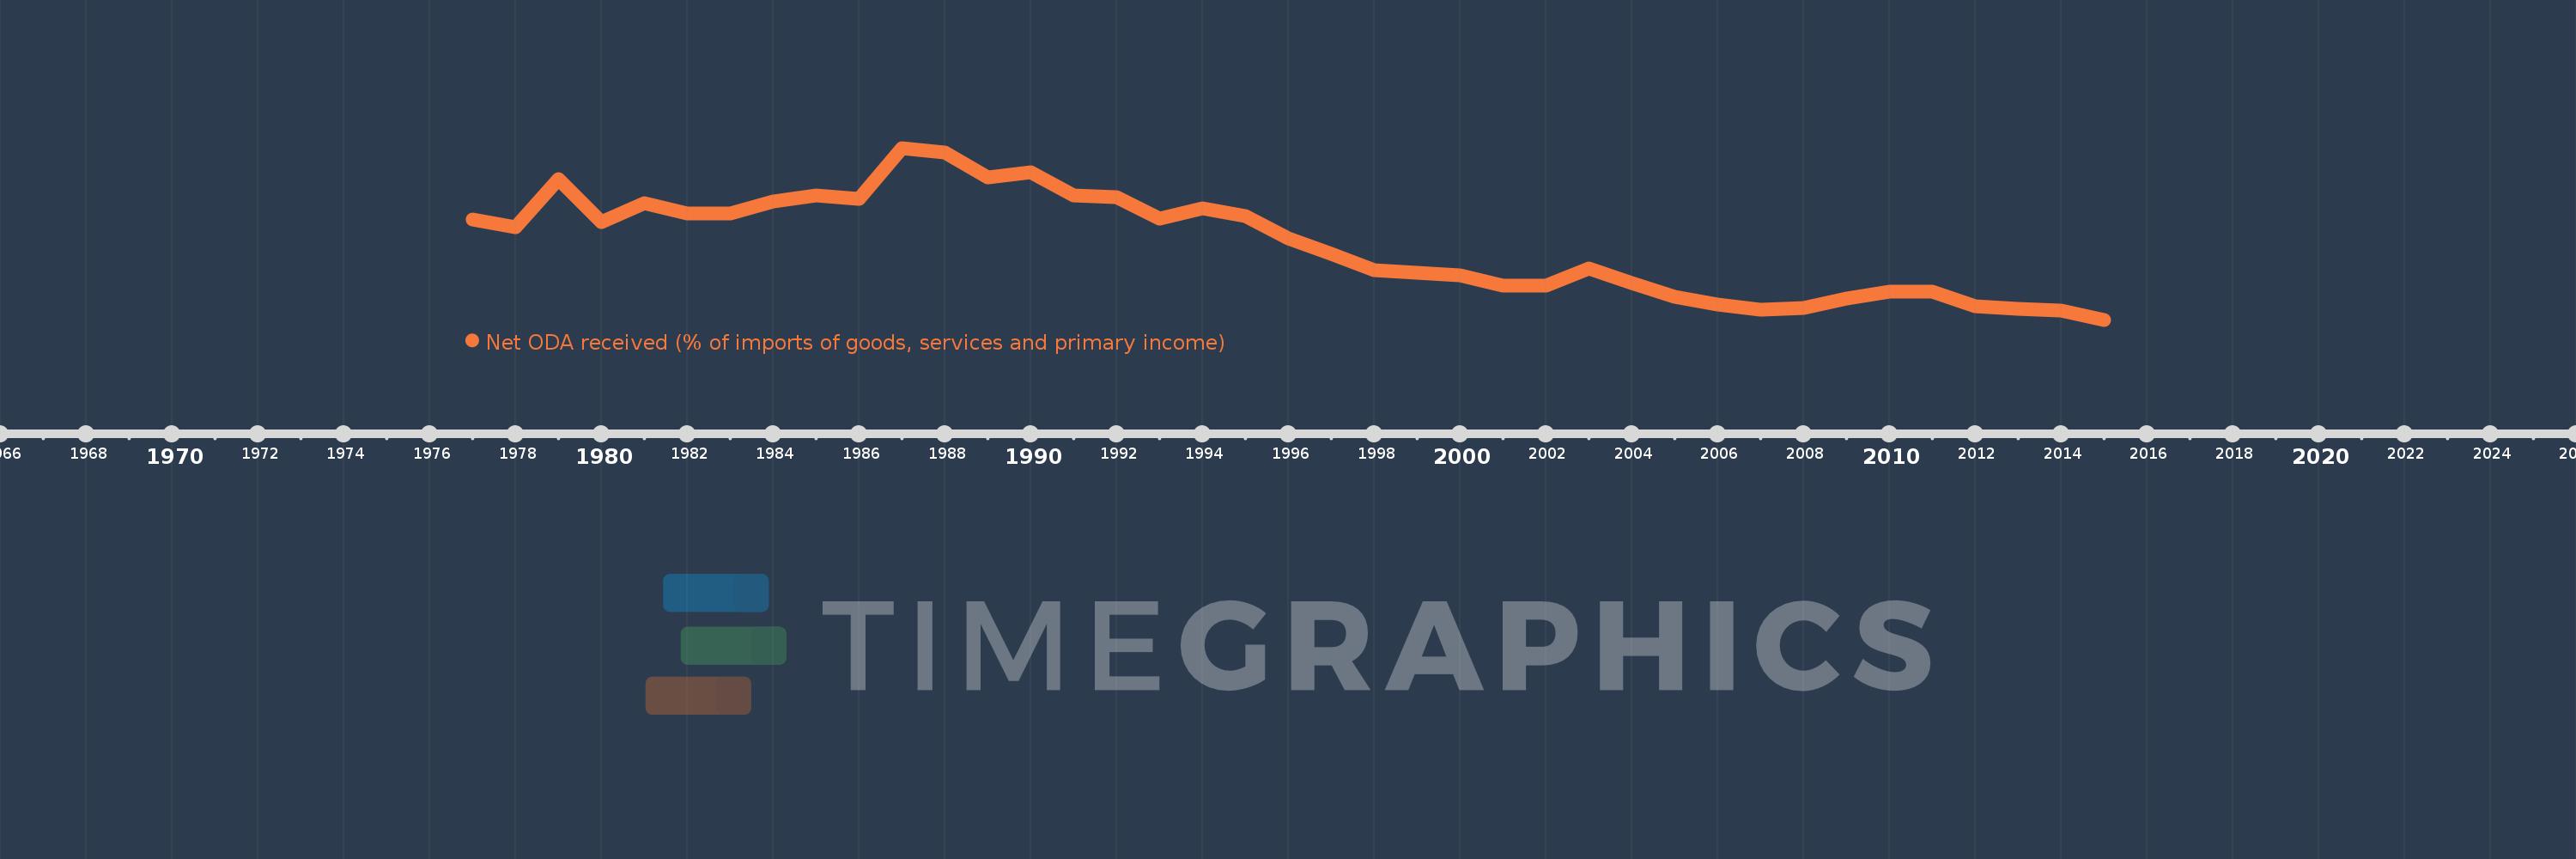
Net ODA received (% of imports of goods, services and primary income)
2015,2014,2013,2012,2011,2010,2009,2008,2007,2006,2005,2004,2003,2002,2001,2000,1999,1998,1997,1996,1995,1994,1993,1992,1991,1990,1989,1988,1987,1986,1985,1984,1983,1982,1981,1980,1979,1978,1977
This statistics in other country:
AfghanistanAlbaniaAlgeriaAngolaAntigua and BarbudaArab WorldArgentinaArmeniaArubaAzerbaijanBahamas, TheBahrainBangladeshBarbadosBelarusBelizeBeninBhutanBoliviaBosnia and HerzegovinaBotswanaBrazilBurkina FasoBurundiCabo VerdeCambodiaCameroonCaribbean small statesCentral African RepublicCentral Europe and the BalticsChadChileChinaColombiaComorosCongo, Dem. Rep.Congo, Rep.Costa RicaCote d'IvoireCroatiaCyprusDjiboutiDominicaDominican RepublicEast Asia & PacificEast Asia & Pacific (excluding high income)East Asia & Pacific (IDA & IBRD countries)EcuadorEgypt, Arab Rep.El SalvadorEquatorial GuineaEritreaEthiopiaEuro areaEurope & Central AsiaEurope & Central Asia (excluding high income)Europe & Central Asia (IDA & IBRD countries)European UnionFijiFragile and conflict affected situationsGabonGambia, TheGeorgiaGhanaGrenadaGuatemalaGuineaGuinea-BissauGuyanaHaitiHeavily indebted poor countries (HIPC)High incomeHondurasIBRD onlyIDA & IBRD totalIDA blendIDA onlyIDA totalIndiaIndonesiaIran, Islamic Rep.IraqIsraelJamaicaJordanKazakhstanKenyaKiribatiKorea, Rep.KosovoKuwaitKyrgyz RepublicLao PDRLatin America & Caribbean Latin America & Caribbean (excluding high income)Latin America & the Caribbean (IDA & IBRD countries)Least developed countries: UN classificationLebanonLesothoLiberiaLibyaLow & middle incomeLow incomeLower middle incomeMacedonia, FYRMadagascarMalawiMalaysiaMaldivesMaliMaltaMarshall IslandsMauritaniaMauritiusMexicoMicronesia, Fed. Sts.Middle East & North Africa (excluding high income)Middle East & North Africa (IDA & IBRD countries)Middle incomeMoldovaMongoliaMontenegroMoroccoMozambiqueMyanmarNamibiaNepalNicaraguaNigerNigeriaNorth AmericaOECD membersOmanOther small statesPacific island small statesPakistanPalauPanamaPapua New GuineaParaguayPeruPhilippinesRwandaSamoaSao Tome and PrincipeSaudi ArabiaSenegalSerbiaSeychellesSierra LeoneSingaporeSloveniaSmall statesSolomon IslandsSouth AfricaSouth AsiaSouth Asia (IDA & IBRD)South SudanSri LankaSt. Kitts and NevisSt. LuciaSt. Vincent and the GrenadinesSub-Saharan Africa Sub-Saharan Africa (excluding high income)Sub-Saharan Africa (IDA & IBRD countries)SudanSurinameSwazilandSyrian Arab RepublicTajikistanTanzaniaThailandTimor-LesteTogoTongaTrinidad and TobagoTunisiaTurkeyTuvaluUgandaUkraineUpper middle incomeUruguayVanuatuVenezuela, RBVietnamWest Bank and GazaWorldYemen, Rep.ZambiaZimbabwe Timeline:
This timeline shows a graph from 1977 to 2015 of Other small states. No data until 1976. Number of actual observations by date: 39.
Source name:
World Development Indicators
Source organization:
Development Assistance Committee of the Organisation for Economic Co-operation and Development, Geographical Distribution of Financial Flows to Developing Countries, Development Co-operation Report, and International Development Statistics database. Data are available online at: www.oecd.org/dac/stats/idsonline. World Bank imports of good and services estimates are used for the denominator.
Categories, topics:
Aid Effectiveness
Last updated:
apr 23, 2017
Indicators value changes by year
At the date of observation
Value
Absolute change
Change from previous value
jan 1, 1977
2.731
+2.731
0.0%
jan 1, 1978
2.574
-0.156
-5.72%
jan 1, 1979
3.538
+0.963
37.41%
jan 1, 1980
2.668
-0.869
-24.57%
jan 1, 1981
3.053
+0.384
14.41%
jan 1, 1982
2.856
-0.197
-6.44%
jan 1, 1983
2.853
-0.003
-0.09%
jan 1, 1984
3.098
+0.245
8.58%
jan 1, 1985
3.209
+0.111
3.58%
jan 1, 1986
3.144
-0.065
-2.03%
jan 1, 1987
4.175
+1.03
32.77%
jan 1, 1988
4.085
-0.089
-2.14%
jan 1, 1989
3.583
-0.503
-12.31%
jan 1, 1990
3.691
+0.108
3.02%
jan 1, 1991
3.214
-0.477
-12.92%
jan 1, 1992
3.185
-0.029
-0.9%
jan 1, 1993
2.752
-0.433
-13.6%
jan 1, 1994
2.957
+0.206
7.48%
jan 1, 1995
2.792
-0.165
-5.59%
jan 1, 1996
2.349
-0.443
-15.88%
jan 1, 1997
2.027
-0.322
-13.7%
jan 1, 1998
1.704
-0.323
-15.95%
jan 1, 1999
1.644
-0.06
-3.51%
jan 1, 2000
1.593
-0.05
-3.07%
jan 1, 2001
1.38
-0.213
-13.37%
jan 1, 2002
1.387
+0.007
0.52%
jan 1, 2003
1.738
+0.35
25.26%
jan 1, 2004
1.439
-0.299
-17.2%
jan 1, 2005
1.161
-0.278
-19.32%
jan 1, 2006
1.002
-0.159
-13.68%
jan 1, 2007
0.902
-0.1
-9.97%
jan 1, 2008
0.941
+0.039
4.33%
jan 1, 2009
1.124
+0.183
19.42%
jan 1, 2010
1.26
+0.136
12.07%
jan 1, 2011
1.27
+0.01
0.78%
jan 1, 2012
0.976
-0.294
-23.13%
jan 1, 2013
0.91
-0.066
-6.75%
jan 1, 2014
0.877
-0.033
-3.65%
jan 1, 2015
0.696
-0.181
-20.62%
Ranking of countries by current statistics by years


Comments: