29
/
en
AIzaSyAYiBZKx7MnpbEhh9jyipgxe19OcubqV5w
April 1, 2024
121262
Dominica
DMA
true
2
1
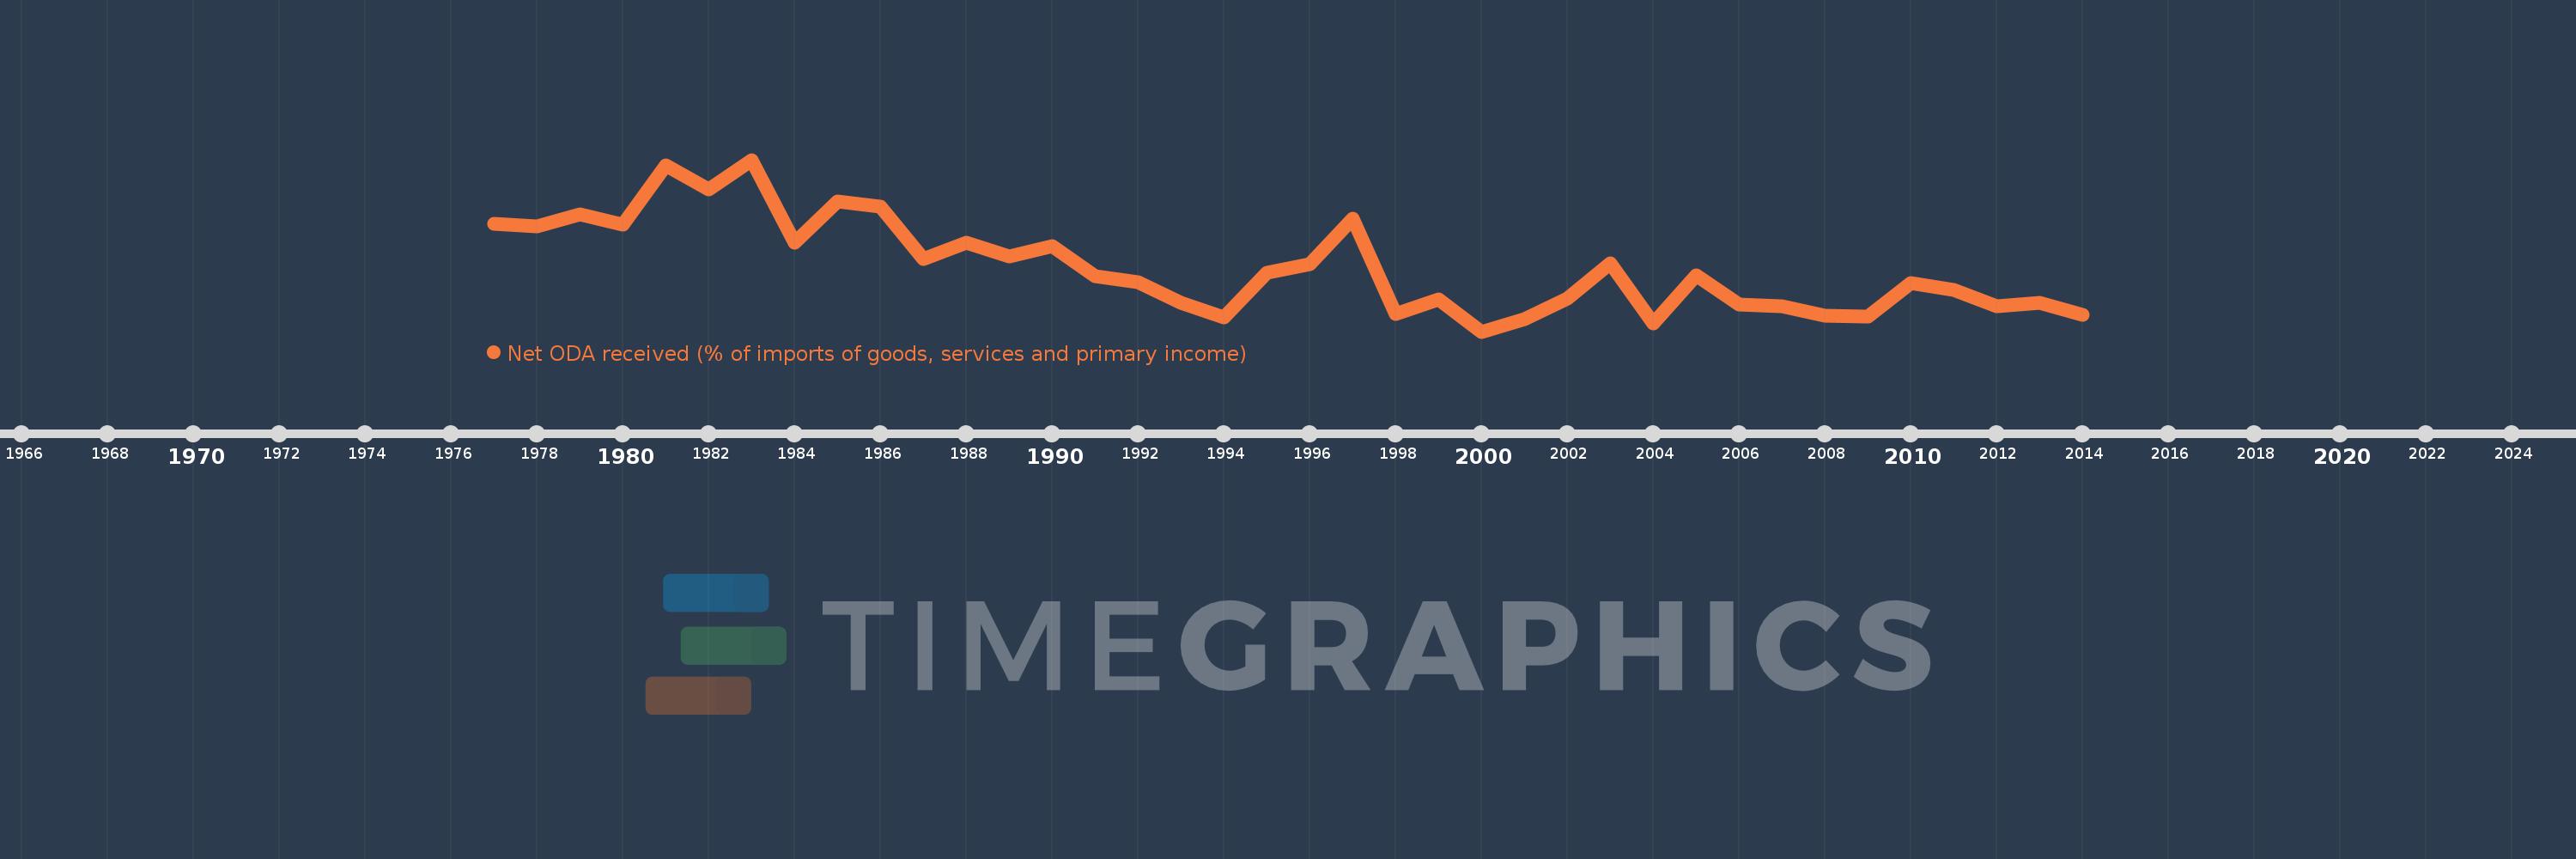
Net ODA received (% of imports of goods, services and primary income)
2014,2013,2012,2011,2010,2009,2008,2007,2006,2005,2004,2003,2002,2001,2000,1999,1998,1997,1996,1995,1994,1993,1992,1991,1990,1989,1988,1987,1986,1985,1984,1983,1982,1981,1980,1979,1978,1977
This statistics in other country:
AfghanistanAlbaniaAlgeriaAngolaAntigua and BarbudaArab WorldArgentinaArmeniaArubaAzerbaijanBahamas, TheBahrainBangladeshBarbadosBelarusBelizeBeninBhutanBoliviaBosnia and HerzegovinaBotswanaBrazilBurkina FasoBurundiCabo VerdeCambodiaCameroonCaribbean small statesCentral African RepublicCentral Europe and the BalticsChadChileChinaColombiaComorosCongo, Dem. Rep.Congo, Rep.Costa RicaCote d'IvoireCroatiaCyprusDjiboutiDominicaDominican RepublicEast Asia & PacificEast Asia & Pacific (excluding high income)East Asia & Pacific (IDA & IBRD countries)EcuadorEgypt, Arab Rep.El SalvadorEquatorial GuineaEritreaEthiopiaEuro areaEurope & Central AsiaEurope & Central Asia (excluding high income)Europe & Central Asia (IDA & IBRD countries)European UnionFijiFragile and conflict affected situationsGabonGambia, TheGeorgiaGhanaGrenadaGuatemalaGuineaGuinea-BissauGuyanaHaitiHeavily indebted poor countries (HIPC)High incomeHondurasIBRD onlyIDA & IBRD totalIDA blendIDA onlyIDA totalIndiaIndonesiaIran, Islamic Rep.IraqIsraelJamaicaJordanKazakhstanKenyaKiribatiKorea, Rep.KosovoKuwaitKyrgyz RepublicLao PDRLatin America & Caribbean Latin America & Caribbean (excluding high income)Latin America & the Caribbean (IDA & IBRD countries)Least developed countries: UN classificationLebanonLesothoLiberiaLibyaLow & middle incomeLow incomeLower middle incomeMacedonia, FYRMadagascarMalawiMalaysiaMaldivesMaliMaltaMarshall IslandsMauritaniaMauritiusMexicoMicronesia, Fed. Sts.Middle East & North Africa (excluding high income)Middle East & North Africa (IDA & IBRD countries)Middle incomeMoldovaMongoliaMontenegroMoroccoMozambiqueMyanmarNamibiaNepalNicaraguaNigerNigeriaNorth AmericaOECD membersOmanOther small statesPacific island small statesPakistanPalauPanamaPapua New GuineaParaguayPeruPhilippinesRwandaSamoaSao Tome and PrincipeSaudi ArabiaSenegalSerbiaSeychellesSierra LeoneSingaporeSloveniaSmall statesSolomon IslandsSouth AfricaSouth AsiaSouth Asia (IDA & IBRD)South SudanSri LankaSt. Kitts and NevisSt. LuciaSt. Vincent and the GrenadinesSub-Saharan Africa Sub-Saharan Africa (excluding high income)Sub-Saharan Africa (IDA & IBRD countries)SudanSurinameSwazilandSyrian Arab RepublicTajikistanTanzaniaThailandTimor-LesteTogoTongaTrinidad and TobagoTunisiaTurkeyTuvaluUgandaUkraineUpper middle incomeUruguayVanuatuVenezuela, RBVietnamWest Bank and GazaWorldYemen, Rep.ZambiaZimbabwe Timeline:
This timeline shows a graph from 1977 to 2014 of Dominica. No data until 1976. Number of actual observations by date: 38.
Source name:
World Development Indicators
Source organization:
Development Assistance Committee of the Organisation for Economic Co-operation and Development, Geographical Distribution of Financial Flows to Developing Countries, Development Co-operation Report, and International Development Statistics database. Data are available online at: www.oecd.org/dac/stats/idsonline. World Bank imports of good and services estimates are used for the denominator.
Categories, topics:
Aid Effectiveness
Last updated:
apr 23, 2017
Indicators value changes by year
Maximum:
32.927
jan 1, 1983
At the date of observation
Value
Absolute change
Change from previous value
jan 1, 1977
22.437
+22.437
0.0%
jan 1, 1978
22.0
-0.437
-1.95%
jan 1, 1979
23.939
+1.939
8.82%
jan 1, 1980
22.236
-1.704
-7.12%
jan 1, 1981
32.018
+9.782
43.99%
jan 1, 1982
28.061
-3.957
-12.36%
jan 1, 1983
32.927
+4.866
17.34%
jan 1, 1984
19.298
-13.629
-41.39%
jan 1, 1985
26.119
+6.821
35.34%
jan 1, 1986
25.251
-0.868
-3.32%
jan 1, 1987
16.564
-8.687
-34.4%
jan 1, 1988
19.241
+2.677
16.16%
jan 1, 1989
17.064
-2.177
-11.31%
jan 1, 1990
18.663
+1.599
9.37%
jan 1, 1991
13.747
-4.916
-26.34%
jan 1, 1992
12.848
-0.899
-6.54%
jan 1, 1993
9.422
-3.426
-26.66%
jan 1, 1994
7.02
-2.402
-25.5%
jan 1, 1995
14.365
+7.345
104.63%
jan 1, 1996
15.738
+1.373
9.56%
jan 1, 1997
23.185
+7.447
47.32%
jan 1, 1998
7.53
-15.655
-67.52%
jan 1, 1999
10.028
+2.499
33.18%
jan 1, 2000
4.669
-5.36
-53.45%
jan 1, 2001
6.69
+2.021
43.29%
jan 1, 2002
10.127
+3.438
51.39%
jan 1, 2003
15.837
+5.71
56.38%
jan 1, 2004
5.987
-9.851
-62.2%
jan 1, 2005
13.936
+7.949
132.78%
jan 1, 2006
9.142
-4.794
-34.4%
jan 1, 2007
8.867
-0.274
-3.0%
jan 1, 2008
7.339
-1.528
-17.24%
jan 1, 2009
7.072
-0.267
-3.64%
jan 1, 2010
12.628
+5.556
78.57%
jan 1, 2011
11.587
-1.041
-8.24%
jan 1, 2012
8.784
-2.803
-24.19%
jan 1, 2013
9.366
+0.582
6.63%
jan 1, 2014
7.478
-1.888
-20.16%
Ranking of countries by current statistics by years


Comments: