29
/
en
AIzaSyAYiBZKx7MnpbEhh9jyipgxe19OcubqV5w
April 1, 2024
188182
Malaysia
MYS
true
2
1
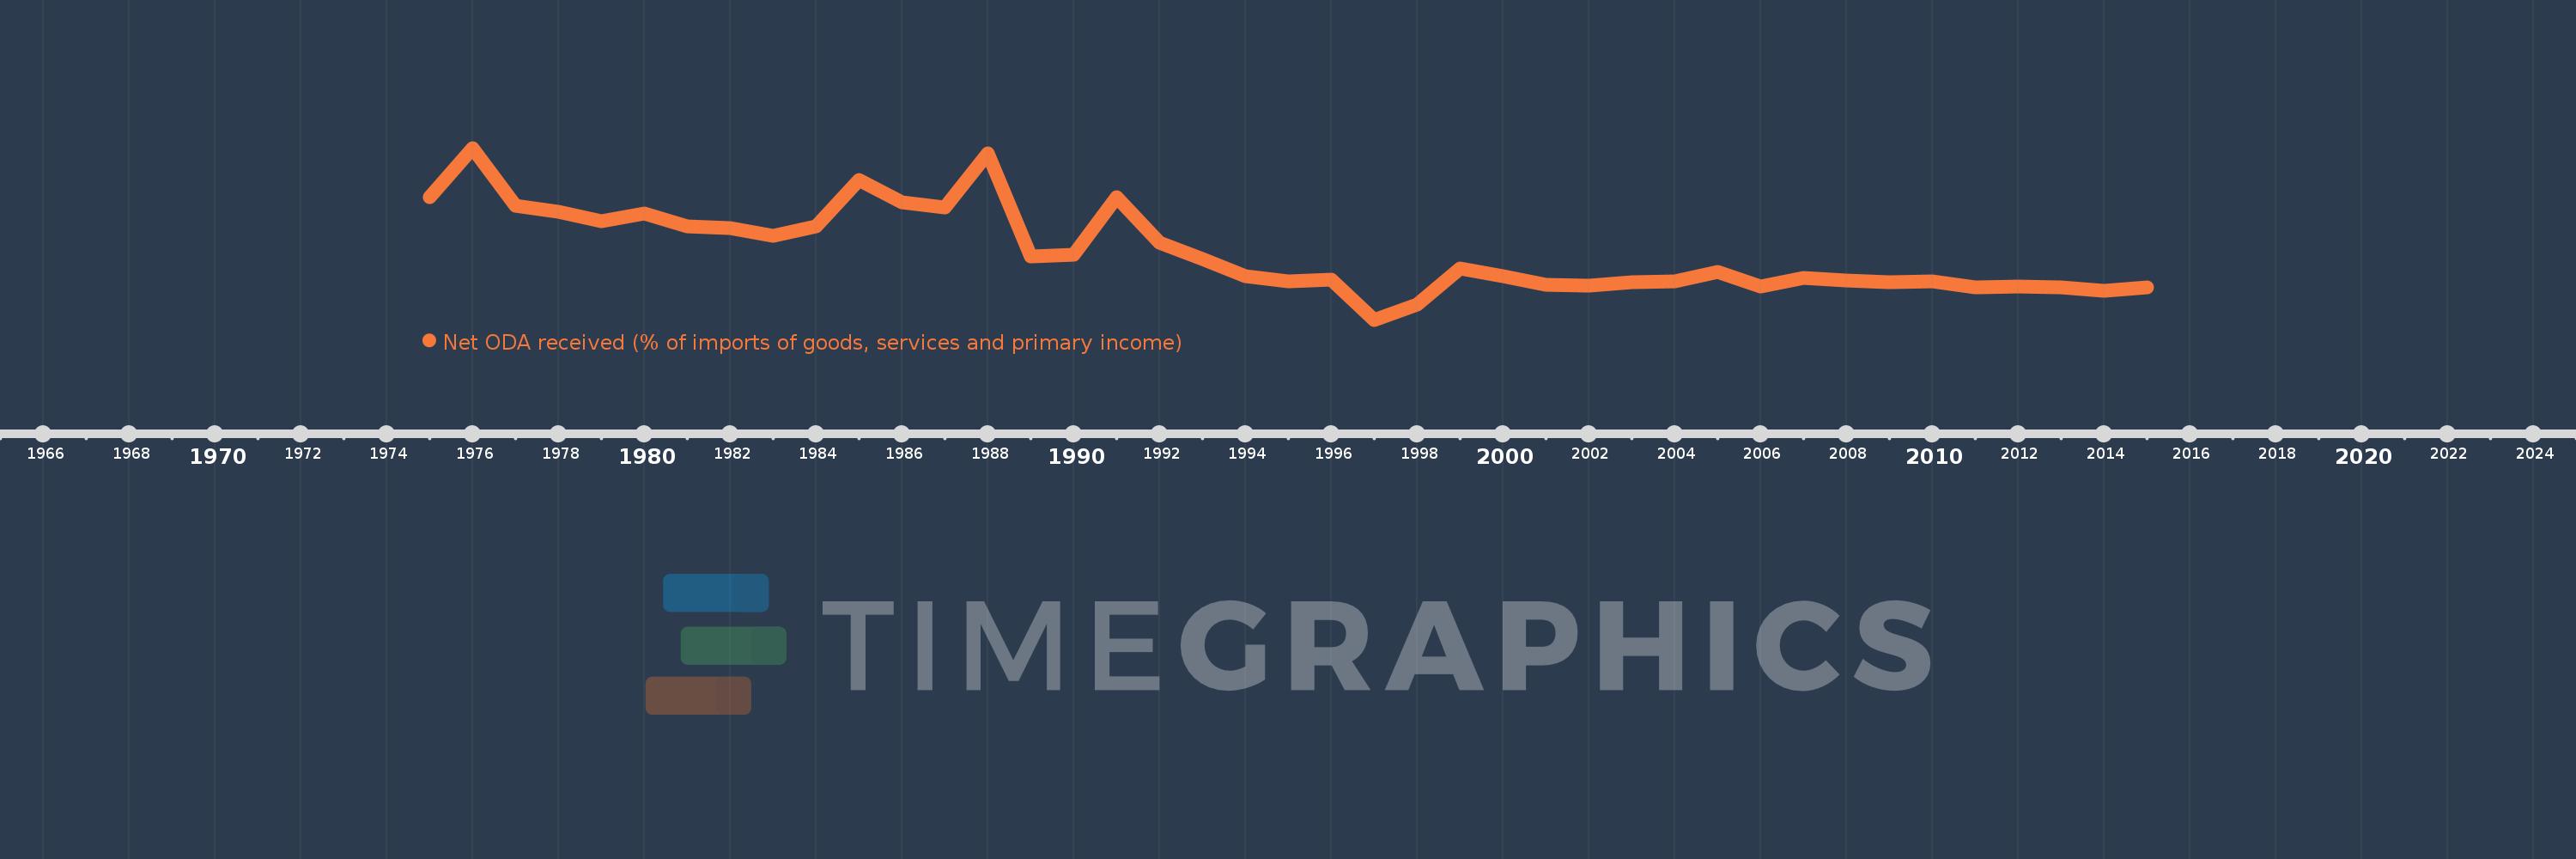
Net ODA received (% of imports of goods, services and primary income)
2015,2014,2013,2012,2011,2010,2009,2008,2007,2006,2005,2004,2003,2002,2001,2000,1999,1998,1997,1996,1995,1994,1993,1992,1991,1990,1989,1988,1987,1986,1985,1984,1983,1982,1981,1980,1979,1978,1977,1976,1975
This statistics in other country:
AfghanistanAlbaniaAlgeriaAngolaAntigua and BarbudaArab WorldArgentinaArmeniaArubaAzerbaijanBahamas, TheBahrainBangladeshBarbadosBelarusBelizeBeninBhutanBoliviaBosnia and HerzegovinaBotswanaBrazilBurkina FasoBurundiCabo VerdeCambodiaCameroonCaribbean small statesCentral African RepublicCentral Europe and the BalticsChadChileChinaColombiaComorosCongo, Dem. Rep.Congo, Rep.Costa RicaCote d'IvoireCroatiaCyprusDjiboutiDominicaDominican RepublicEast Asia & PacificEast Asia & Pacific (excluding high income)East Asia & Pacific (IDA & IBRD countries)EcuadorEgypt, Arab Rep.El SalvadorEquatorial GuineaEritreaEthiopiaEuro areaEurope & Central AsiaEurope & Central Asia (excluding high income)Europe & Central Asia (IDA & IBRD countries)European UnionFijiFragile and conflict affected situationsGabonGambia, TheGeorgiaGhanaGrenadaGuatemalaGuineaGuinea-BissauGuyanaHaitiHeavily indebted poor countries (HIPC)High incomeHondurasIBRD onlyIDA & IBRD totalIDA blendIDA onlyIDA totalIndiaIndonesiaIran, Islamic Rep.IraqIsraelJamaicaJordanKazakhstanKenyaKiribatiKorea, Rep.KosovoKuwaitKyrgyz RepublicLao PDRLatin America & Caribbean Latin America & Caribbean (excluding high income)Latin America & the Caribbean (IDA & IBRD countries)Least developed countries: UN classificationLebanonLesothoLiberiaLibyaLow & middle incomeLow incomeLower middle incomeMacedonia, FYRMadagascarMalawiMalaysiaMaldivesMaliMaltaMarshall IslandsMauritaniaMauritiusMexicoMicronesia, Fed. Sts.Middle East & North Africa (excluding high income)Middle East & North Africa (IDA & IBRD countries)Middle incomeMoldovaMongoliaMontenegroMoroccoMozambiqueMyanmarNamibiaNepalNicaraguaNigerNigeriaNorth AmericaOECD membersOmanOther small statesPacific island small statesPakistanPalauPanamaPapua New GuineaParaguayPeruPhilippinesRwandaSamoaSao Tome and PrincipeSaudi ArabiaSenegalSerbiaSeychellesSierra LeoneSingaporeSloveniaSmall statesSolomon IslandsSouth AfricaSouth AsiaSouth Asia (IDA & IBRD)South SudanSri LankaSt. Kitts and NevisSt. LuciaSt. Vincent and the GrenadinesSub-Saharan Africa Sub-Saharan Africa (excluding high income)Sub-Saharan Africa (IDA & IBRD countries)SudanSurinameSwazilandSyrian Arab RepublicTajikistanTanzaniaThailandTimor-LesteTogoTongaTrinidad and TobagoTunisiaTurkeyTuvaluUgandaUkraineUpper middle incomeUruguayVanuatuVenezuela, RBVietnamWest Bank and GazaWorldYemen, Rep.ZambiaZimbabwe Timeline:
This timeline shows a graph from 1975 to 2015 of Malaysia. No data until 1974. Number of actual observations by date: 41.
Source name:
World Development Indicators
Source organization:
Development Assistance Committee of the Organisation for Economic Co-operation and Development, Geographical Distribution of Financial Flows to Developing Countries, Development Co-operation Report, and International Development Statistics database. Data are available online at: www.oecd.org/dac/stats/idsonline. World Bank imports of good and services estimates are used for the denominator.
Categories, topics:
Aid Effectiveness
Last updated:
apr 23, 2017
Indicators value changes by year
Minimum:
-0.466
jan 1, 1997
At the date of observation
Value
Absolute change
Change from previous value
jan 1, 1975
1.322
+1.322
0.0%
jan 1, 1976
2.039
+0.717
54.24%
jan 1, 1977
1.199
-0.84
-41.19%
jan 1, 1978
1.109
-0.09
-7.5%
jan 1, 1979
0.969
-0.14
-12.6%
jan 1, 1980
1.084
+0.114
11.8%
jan 1, 1981
0.891
-0.193
-17.76%
jan 1, 1982
0.875
-0.016
-1.78%
jan 1, 1983
0.754
-0.121
-13.87%
jan 1, 1984
0.893
+0.139
18.43%
jan 1, 1985
1.575
+0.682
76.35%
jan 1, 1986
1.244
-0.331
-21.0%
jan 1, 1987
1.172
-0.072
-5.77%
jan 1, 1988
1.963
+0.791
67.47%
jan 1, 1989
0.454
-1.509
-76.88%
jan 1, 1990
0.488
+0.034
7.53%
jan 1, 1991
1.32
+0.832
170.57%
jan 1, 1992
0.661
-0.659
-49.95%
jan 1, 1993
0.418
-0.243
-36.77%
jan 1, 1994
0.164
-0.253
-60.66%
jan 1, 1995
0.09
-0.074
-45.08%
jan 1, 1996
0.115
+0.025
27.93%
jan 1, 1997
-0.466
-0.581
-503.26%
jan 1, 1998
-0.24
+0.226
-48.44%
jan 1, 1999
0.277
+0.517
-215.18%
jan 1, 2000
0.173
-0.104
-37.54%
jan 1, 2001
0.044
-0.129
-74.54%
jan 1, 2002
0.032
-0.012
-26.33%
jan 1, 2003
0.086
+0.054
166.78%
jan 1, 2004
0.1
+0.014
16.25%
jan 1, 2005
0.237
+0.136
135.54%
jan 1, 2006
0.018
-0.218
-92.23%
jan 1, 2007
0.149
+0.131
710.16%
jan 1, 2008
0.11
-0.039
-26.39%
jan 1, 2009
0.078
-0.032
-28.77%
jan 1, 2010
0.089
+0.011
14.3%
jan 1, 2011
0.001
-0.088
-98.86%
jan 1, 2012
0.017
+0.016
1.53K%
jan 1, 2013
0.006
-0.01
-61.4%
jan 1, 2014
-0.049
-0.056
-872.98%
jan 1, 2015
0.005
+0.054
-109.84%
Ranking of countries by current statistics by years


Comments: