29
/
en
AIzaSyAYiBZKx7MnpbEhh9jyipgxe19OcubqV5w
April 1, 2024
112650
Costa Rica
CRI
true
2
1
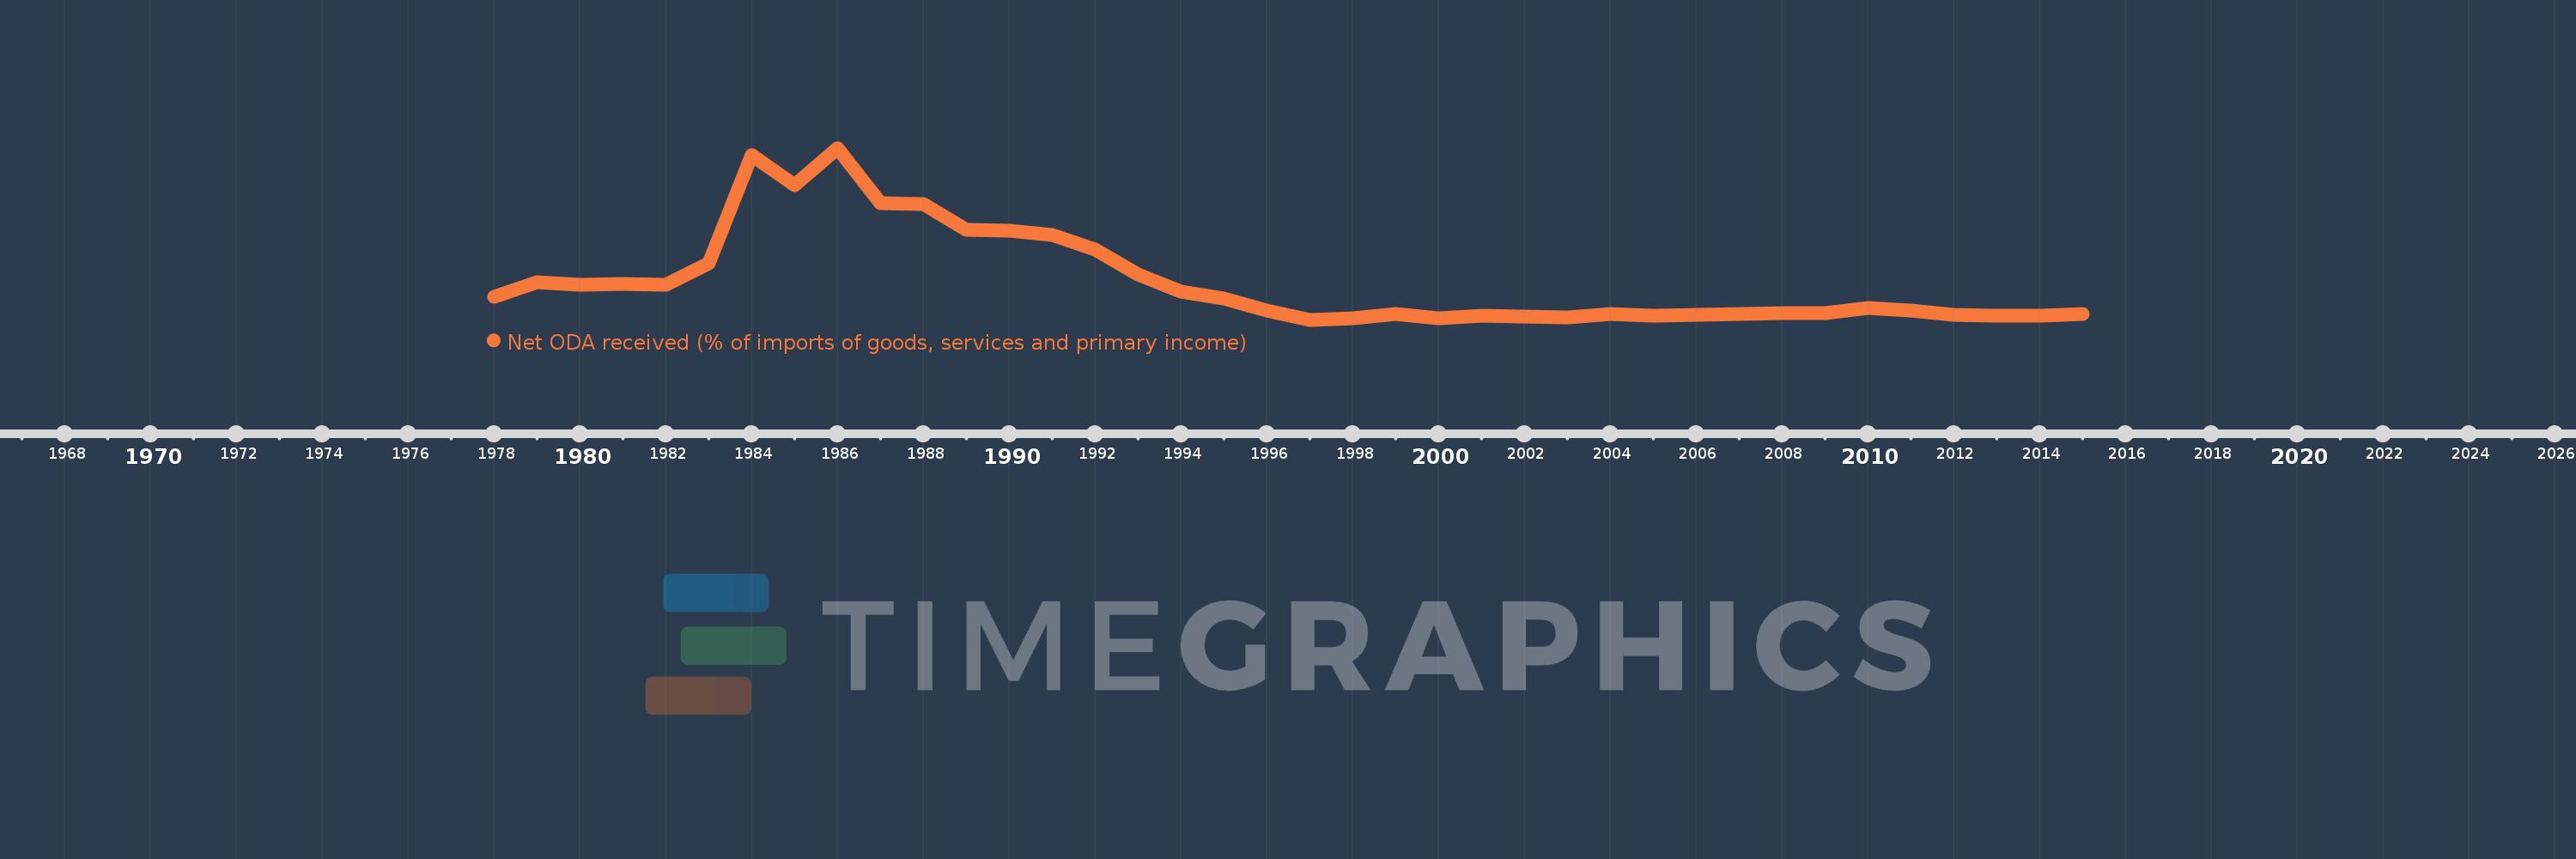
Net ODA received (% of imports of goods, services and primary income)
2015,2014,2013,2012,2011,2010,2009,2008,2007,2006,2005,2004,2003,2002,2001,2000,1999,1998,1997,1996,1995,1994,1993,1992,1991,1990,1989,1988,1987,1986,1985,1984,1983,1982,1981,1980,1979,1978
This statistics in other country:
AfghanistanAlbaniaAlgeriaAngolaAntigua and BarbudaArab WorldArgentinaArmeniaArubaAzerbaijanBahamas, TheBahrainBangladeshBarbadosBelarusBelizeBeninBhutanBoliviaBosnia and HerzegovinaBotswanaBrazilBurkina FasoBurundiCabo VerdeCambodiaCameroonCaribbean small statesCentral African RepublicCentral Europe and the BalticsChadChileChinaColombiaComorosCongo, Dem. Rep.Congo, Rep.Costa RicaCote d'IvoireCroatiaCyprusDjiboutiDominicaDominican RepublicEast Asia & PacificEast Asia & Pacific (excluding high income)East Asia & Pacific (IDA & IBRD countries)EcuadorEgypt, Arab Rep.El SalvadorEquatorial GuineaEritreaEthiopiaEuro areaEurope & Central AsiaEurope & Central Asia (excluding high income)Europe & Central Asia (IDA & IBRD countries)European UnionFijiFragile and conflict affected situationsGabonGambia, TheGeorgiaGhanaGrenadaGuatemalaGuineaGuinea-BissauGuyanaHaitiHeavily indebted poor countries (HIPC)High incomeHondurasIBRD onlyIDA & IBRD totalIDA blendIDA onlyIDA totalIndiaIndonesiaIran, Islamic Rep.IraqIsraelJamaicaJordanKazakhstanKenyaKiribatiKorea, Rep.KosovoKuwaitKyrgyz RepublicLao PDRLatin America & Caribbean Latin America & Caribbean (excluding high income)Latin America & the Caribbean (IDA & IBRD countries)Least developed countries: UN classificationLebanonLesothoLiberiaLibyaLow & middle incomeLow incomeLower middle incomeMacedonia, FYRMadagascarMalawiMalaysiaMaldivesMaliMaltaMarshall IslandsMauritaniaMauritiusMexicoMicronesia, Fed. Sts.Middle East & North Africa (excluding high income)Middle East & North Africa (IDA & IBRD countries)Middle incomeMoldovaMongoliaMontenegroMoroccoMozambiqueMyanmarNamibiaNepalNicaraguaNigerNigeriaNorth AmericaOECD membersOmanOther small statesPacific island small statesPakistanPalauPanamaPapua New GuineaParaguayPeruPhilippinesRwandaSamoaSao Tome and PrincipeSaudi ArabiaSenegalSerbiaSeychellesSierra LeoneSingaporeSloveniaSmall statesSolomon IslandsSouth AfricaSouth AsiaSouth Asia (IDA & IBRD)South SudanSri LankaSt. Kitts and NevisSt. LuciaSt. Vincent and the GrenadinesSub-Saharan Africa Sub-Saharan Africa (excluding high income)Sub-Saharan Africa (IDA & IBRD countries)SudanSurinameSwazilandSyrian Arab RepublicTajikistanTanzaniaThailandTimor-LesteTogoTongaTrinidad and TobagoTunisiaTurkeyTuvaluUgandaUkraineUpper middle incomeUruguayVanuatuVenezuela, RBVietnamWest Bank and GazaWorldYemen, Rep.ZambiaZimbabwe Timeline:
This timeline shows a graph from 1978 to 2015 of Costa Rica. No data until 1977. Number of actual observations by date: 38.
Source name:
World Development Indicators
Source organization:
Development Assistance Committee of the Organisation for Economic Co-operation and Development, Geographical Distribution of Financial Flows to Developing Countries, Development Co-operation Report, and International Development Statistics database. Data are available online at: www.oecd.org/dac/stats/idsonline. World Bank imports of good and services estimates are used for the denominator.
Categories, topics:
Aid Effectiveness
Last updated:
apr 23, 2017
Indicators value changes by year
Minimum:
-0.278
jan 1, 1997
Maximum:
17.294
jan 1, 1986
At the date of observation
Value
Absolute change
Change from previous value
jan 1, 1978
2.081
+2.081
0.0%
jan 1, 1979
3.603
+1.522
73.12%
jan 1, 1980
3.283
-0.32
-8.87%
jan 1, 1981
3.396
+0.113
3.46%
jan 1, 1982
3.32
-0.076
-2.25%
jan 1, 1983
5.526
+2.206
66.45%
jan 1, 1984
16.53
+11.004
199.12%
jan 1, 1985
13.518
-3.012
-18.22%
jan 1, 1986
17.294
+3.776
27.94%
jan 1, 1987
11.637
-5.658
-32.71%
jan 1, 1988
11.534
-0.103
-0.88%
jan 1, 1989
8.96
-2.575
-22.32%
jan 1, 1990
8.842
-0.118
-1.32%
jan 1, 1991
8.378
-0.464
-5.25%
jan 1, 1992
6.913
-1.464
-17.48%
jan 1, 1993
4.334
-2.58
-37.31%
jan 1, 1994
2.618
-1.715
-39.58%
jan 1, 1995
1.931
-0.687
-26.25%
jan 1, 1996
0.685
-1.246
-64.54%
jan 1, 1997
-0.278
-0.962
-140.54%
jan 1, 1998
-0.156
+0.122
-43.91%
jan 1, 1999
0.282
+0.437
-280.82%
jan 1, 2000
-0.137
-0.419
-148.72%
jan 1, 2001
0.127
+0.264
-192.73%
jan 1, 2002
0.005
-0.122
-96.07%
jan 1, 2003
-0.004
-0.009
-187.89%
jan 1, 2004
0.35
+0.354
-8.06K%
jan 1, 2005
0.142
-0.207
-59.26%
jan 1, 2006
0.253
+0.111
77.74%
jan 1, 2007
0.273
+0.02
7.78%
jan 1, 2008
0.43
+0.157
57.42%
jan 1, 2009
0.425
-0.005
-1.1%
jan 1, 2010
0.907
+0.482
113.46%
jan 1, 2011
0.653
-0.254
-27.99%
jan 1, 2012
0.21
-0.443
-67.79%
jan 1, 2013
0.155
-0.055
-26.24%
jan 1, 2014
0.176
+0.021
13.69%
jan 1, 2015
0.273
+0.097
54.95%
Ranking of countries by current statistics by years


Comments: