29
/
en
AIzaSyAYiBZKx7MnpbEhh9jyipgxe19OcubqV5w
April 1, 2024
108849
Comoros
COM
true
2
1
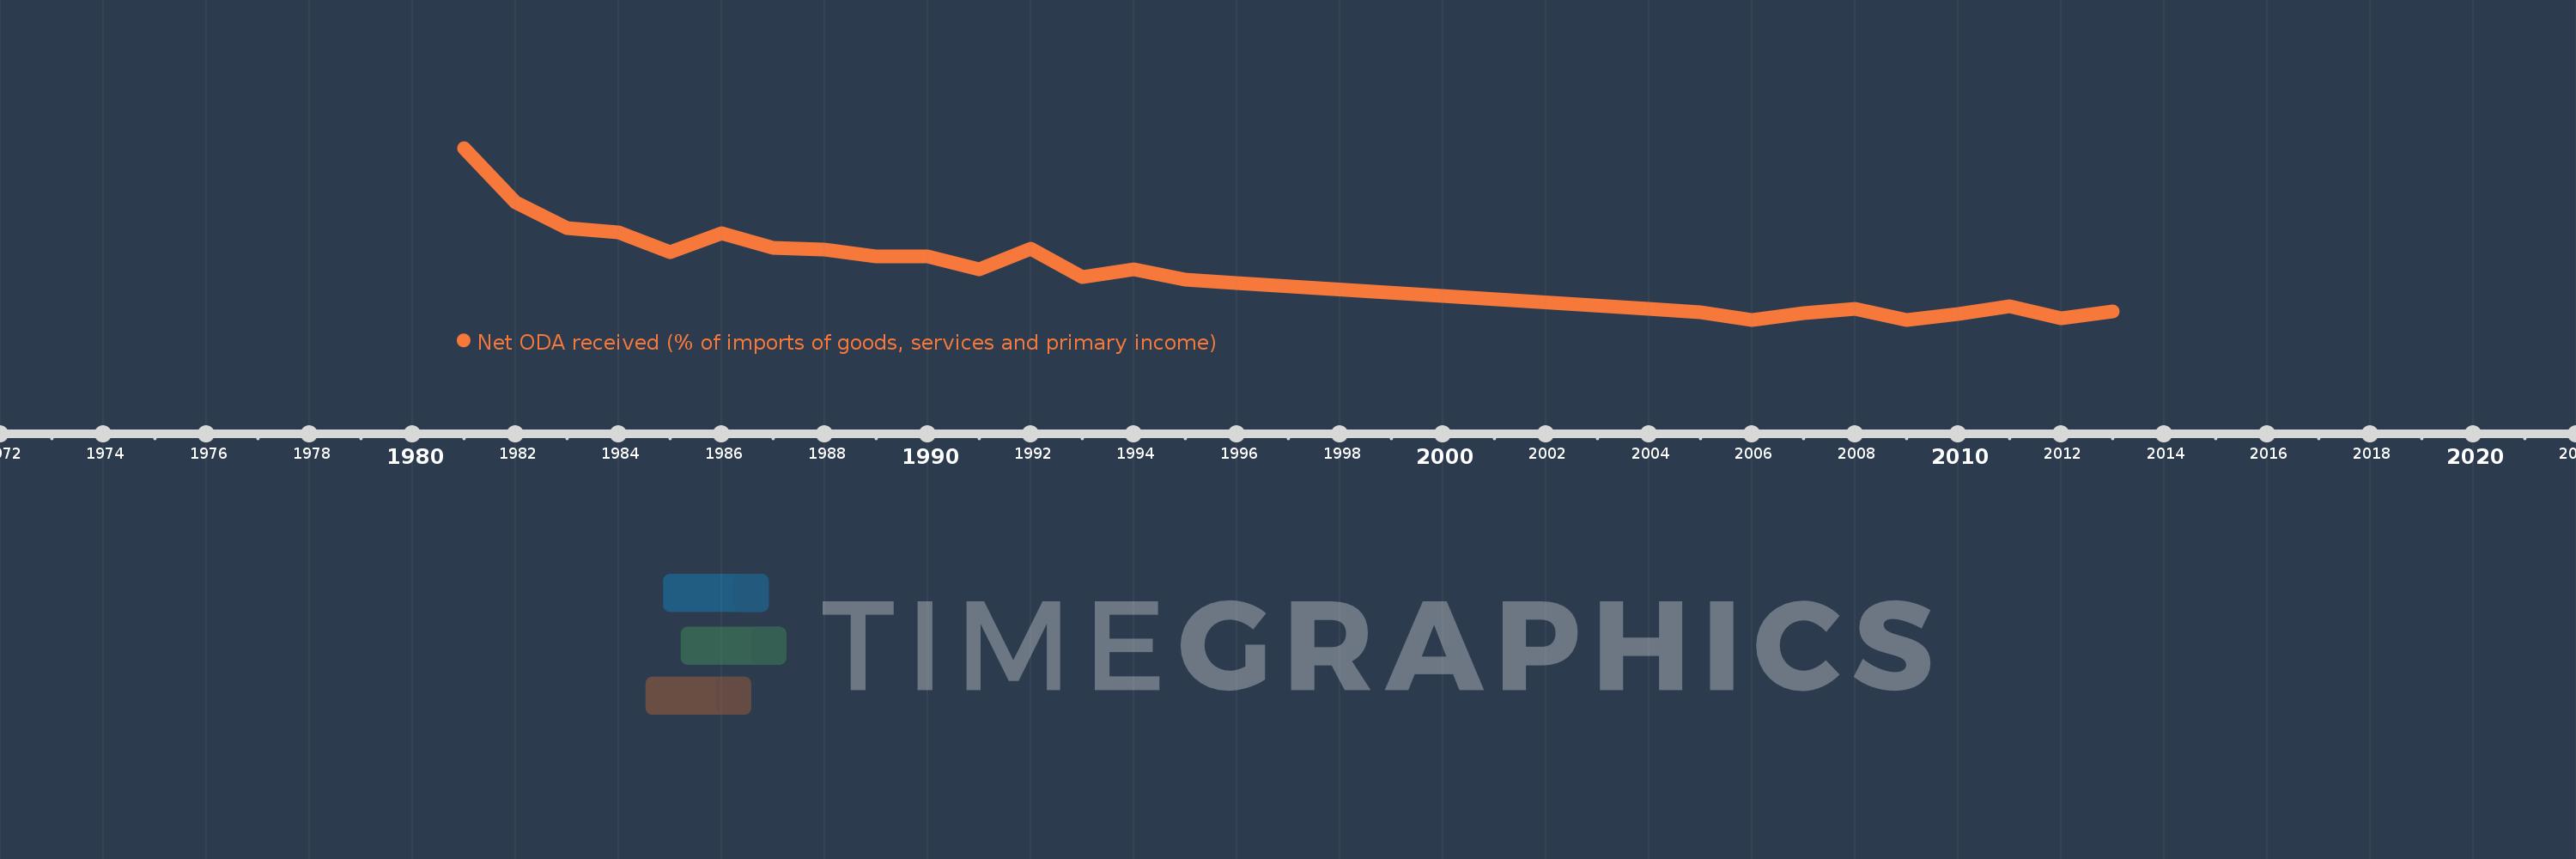
Net ODA received (% of imports of goods, services and primary income)
2013,2012,2011,2010,2009,2008,2007,2006,2005,2004,1996,1995,1994,1993,1992,1991,1990,1989,1988,1987,1986,1985,1984,1983,1982,1981
This statistics in other country:
AfghanistanAlbaniaAlgeriaAngolaAntigua and BarbudaArab WorldArgentinaArmeniaArubaAzerbaijanBahamas, TheBahrainBangladeshBarbadosBelarusBelizeBeninBhutanBoliviaBosnia and HerzegovinaBotswanaBrazilBurkina FasoBurundiCabo VerdeCambodiaCameroonCaribbean small statesCentral African RepublicCentral Europe and the BalticsChadChileChinaColombiaComorosCongo, Dem. Rep.Congo, Rep.Costa RicaCote d'IvoireCroatiaCyprusDjiboutiDominicaDominican RepublicEast Asia & PacificEast Asia & Pacific (excluding high income)East Asia & Pacific (IDA & IBRD countries)EcuadorEgypt, Arab Rep.El SalvadorEquatorial GuineaEritreaEthiopiaEuro areaEurope & Central AsiaEurope & Central Asia (excluding high income)Europe & Central Asia (IDA & IBRD countries)European UnionFijiFragile and conflict affected situationsGabonGambia, TheGeorgiaGhanaGrenadaGuatemalaGuineaGuinea-BissauGuyanaHaitiHeavily indebted poor countries (HIPC)High incomeHondurasIBRD onlyIDA & IBRD totalIDA blendIDA onlyIDA totalIndiaIndonesiaIran, Islamic Rep.IraqIsraelJamaicaJordanKazakhstanKenyaKiribatiKorea, Rep.KosovoKuwaitKyrgyz RepublicLao PDRLatin America & Caribbean Latin America & Caribbean (excluding high income)Latin America & the Caribbean (IDA & IBRD countries)Least developed countries: UN classificationLebanonLesothoLiberiaLibyaLow & middle incomeLow incomeLower middle incomeMacedonia, FYRMadagascarMalawiMalaysiaMaldivesMaliMaltaMarshall IslandsMauritaniaMauritiusMexicoMicronesia, Fed. Sts.Middle East & North Africa (excluding high income)Middle East & North Africa (IDA & IBRD countries)Middle incomeMoldovaMongoliaMontenegroMoroccoMozambiqueMyanmarNamibiaNepalNicaraguaNigerNigeriaNorth AmericaOECD membersOmanOther small statesPacific island small statesPakistanPalauPanamaPapua New GuineaParaguayPeruPhilippinesRwandaSamoaSao Tome and PrincipeSaudi ArabiaSenegalSerbiaSeychellesSierra LeoneSingaporeSloveniaSmall statesSolomon IslandsSouth AfricaSouth AsiaSouth Asia (IDA & IBRD)South SudanSri LankaSt. Kitts and NevisSt. LuciaSt. Vincent and the GrenadinesSub-Saharan Africa Sub-Saharan Africa (excluding high income)Sub-Saharan Africa (IDA & IBRD countries)SudanSurinameSwazilandSyrian Arab RepublicTajikistanTanzaniaThailandTimor-LesteTogoTongaTrinidad and TobagoTunisiaTurkeyTuvaluUgandaUkraineUpper middle incomeUruguayVanuatuVenezuela, RBVietnamWest Bank and GazaWorldYemen, Rep.ZambiaZimbabwe Timeline:
This timeline shows a graph from 1981 to 2013 of Comoros. No data until 1980. Number of actual observations by date: 26.
Source name:
World Development Indicators
Source organization:
Development Assistance Committee of the Organisation for Economic Co-operation and Development, Geographical Distribution of Financial Flows to Developing Countries, Development Co-operation Report, and International Development Statistics database. Data are available online at: www.oecd.org/dac/stats/idsonline. World Bank imports of good and services estimates are used for the denominator.
Categories, topics:
Aid Effectiveness
Last updated:
apr 23, 2017
Indicators value changes by year
Minimum:
15.817
jan 1, 2006
Maximum:
125.969
jan 1, 1981
At the date of observation
Value
Absolute change
Change from previous value
jan 1, 1981
125.969
+125.969
0.0%
jan 1, 1982
91.358
-34.611
-27.48%
jan 1, 1983
74.313
-17.044
-18.66%
jan 1, 1984
71.833
-2.48
-3.34%
jan 1, 1985
59.351
-12.483
-17.38%
jan 1, 1986
71.325
+11.975
20.18%
jan 1, 1987
62.117
-9.208
-12.91%
jan 1, 1988
60.84
-1.277
-2.06%
jan 1, 1989
56.578
-4.263
-7.01%
jan 1, 1990
56.356
-0.222
-0.39%
jan 1, 1991
48.073
-8.283
-14.7%
jan 1, 1992
61.419
+13.346
27.76%
jan 1, 1993
43.211
-18.208
-29.65%
jan 1, 1994
48.293
+5.082
11.76%
jan 1, 1995
41.511
-6.781
-14.04%
jan 1, 1996
39.341
-2.17
-5.23%
jan 1, 2004
22.675
-16.667
-42.36%
jan 1, 2005
20.862
-1.813
-7.99%
jan 1, 2006
15.817
-5.046
-24.19%
jan 1, 2007
19.835
+4.018
25.41%
jan 1, 2008
23.053
+3.218
16.22%
jan 1, 2009
15.854
-7.199
-31.23%
jan 1, 2010
19.553
+3.699
23.33%
jan 1, 2011
24.407
+4.855
24.83%
jan 1, 2012
16.665
-7.743
-31.72%
jan 1, 2013
20.993
+4.328
25.97%
Ranking of countries by current statistics by years


Comments: