29
/
en
AIzaSyAYiBZKx7MnpbEhh9jyipgxe19OcubqV5w
April 1, 2024
150784
Honduras
HND
true
2
1
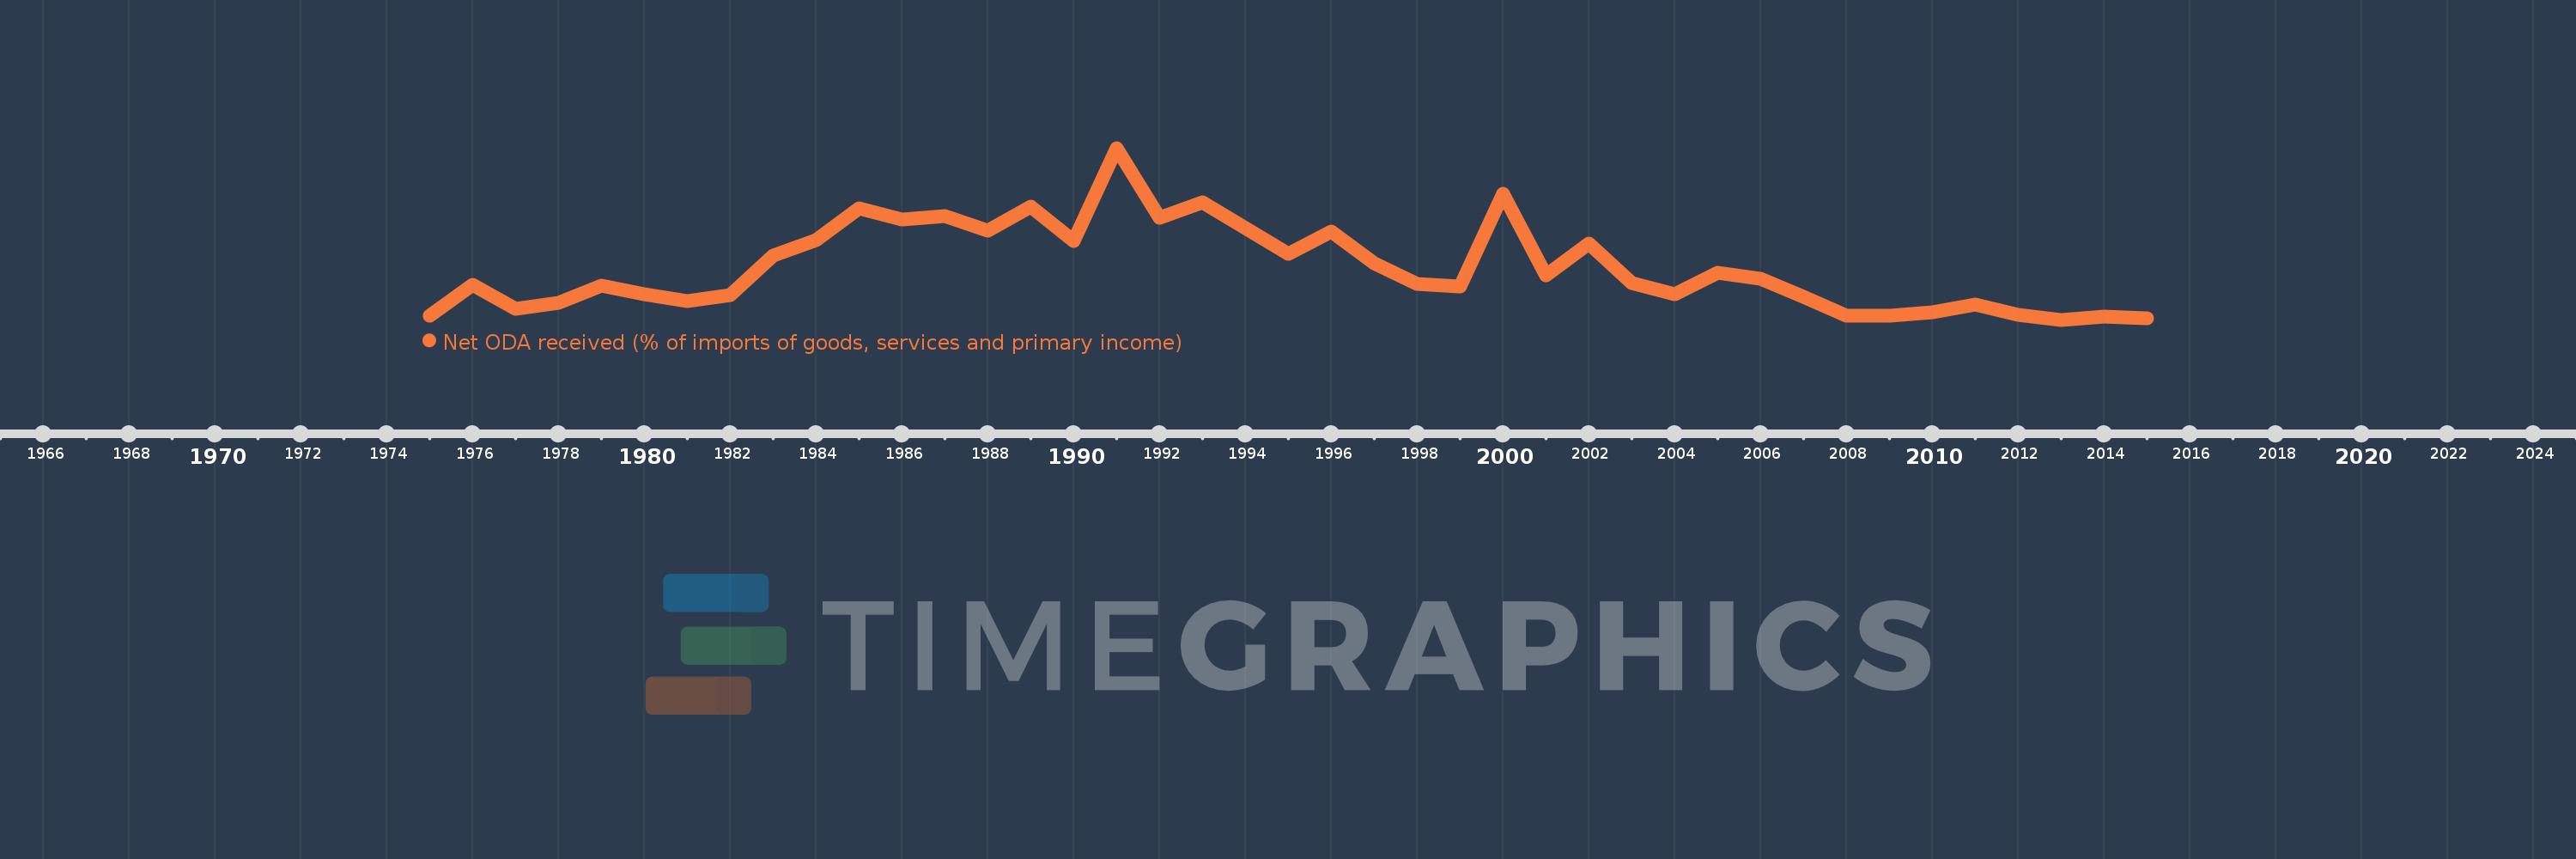
Net ODA received (% of imports of goods, services and primary income)
2015,2014,2013,2012,2011,2010,2009,2008,2007,2006,2005,2004,2003,2002,2001,2000,1999,1998,1997,1996,1995,1994,1993,1992,1991,1990,1989,1988,1987,1986,1985,1984,1983,1982,1981,1980,1979,1978,1977,1976,1975
This statistics in other country:
AfghanistanAlbaniaAlgeriaAngolaAntigua and BarbudaArab WorldArgentinaArmeniaArubaAzerbaijanBahamas, TheBahrainBangladeshBarbadosBelarusBelizeBeninBhutanBoliviaBosnia and HerzegovinaBotswanaBrazilBurkina FasoBurundiCabo VerdeCambodiaCameroonCaribbean small statesCentral African RepublicCentral Europe and the BalticsChadChileChinaColombiaComorosCongo, Dem. Rep.Congo, Rep.Costa RicaCote d'IvoireCroatiaCyprusDjiboutiDominicaDominican RepublicEast Asia & PacificEast Asia & Pacific (excluding high income)East Asia & Pacific (IDA & IBRD countries)EcuadorEgypt, Arab Rep.El SalvadorEquatorial GuineaEritreaEthiopiaEuro areaEurope & Central AsiaEurope & Central Asia (excluding high income)Europe & Central Asia (IDA & IBRD countries)European UnionFijiFragile and conflict affected situationsGabonGambia, TheGeorgiaGhanaGrenadaGuatemalaGuineaGuinea-BissauGuyanaHaitiHeavily indebted poor countries (HIPC)High incomeHondurasIBRD onlyIDA & IBRD totalIDA blendIDA onlyIDA totalIndiaIndonesiaIran, Islamic Rep.IraqIsraelJamaicaJordanKazakhstanKenyaKiribatiKorea, Rep.KosovoKuwaitKyrgyz RepublicLao PDRLatin America & Caribbean Latin America & Caribbean (excluding high income)Latin America & the Caribbean (IDA & IBRD countries)Least developed countries: UN classificationLebanonLesothoLiberiaLibyaLow & middle incomeLow incomeLower middle incomeMacedonia, FYRMadagascarMalawiMalaysiaMaldivesMaliMaltaMarshall IslandsMauritaniaMauritiusMexicoMicronesia, Fed. Sts.Middle East & North Africa (excluding high income)Middle East & North Africa (IDA & IBRD countries)Middle incomeMoldovaMongoliaMontenegroMoroccoMozambiqueMyanmarNamibiaNepalNicaraguaNigerNigeriaNorth AmericaOECD membersOmanOther small statesPacific island small statesPakistanPalauPanamaPapua New GuineaParaguayPeruPhilippinesRwandaSamoaSao Tome and PrincipeSaudi ArabiaSenegalSerbiaSeychellesSierra LeoneSingaporeSloveniaSmall statesSolomon IslandsSouth AfricaSouth AsiaSouth Asia (IDA & IBRD)South SudanSri LankaSt. Kitts and NevisSt. LuciaSt. Vincent and the GrenadinesSub-Saharan Africa Sub-Saharan Africa (excluding high income)Sub-Saharan Africa (IDA & IBRD countries)SudanSurinameSwazilandSyrian Arab RepublicTajikistanTanzaniaThailandTimor-LesteTogoTongaTrinidad and TobagoTunisiaTurkeyTuvaluUgandaUkraineUpper middle incomeUruguayVanuatuVenezuela, RBVietnamWest Bank and GazaWorldYemen, Rep.ZambiaZimbabwe Timeline:
This timeline shows a graph from 1975 to 2015 of Honduras. No data until 1974. Number of actual observations by date: 41.
Source name:
World Development Indicators
Source organization:
Development Assistance Committee of the Organisation for Economic Co-operation and Development, Geographical Distribution of Financial Flows to Developing Countries, Development Co-operation Report, and International Development Statistics database. Data are available online at: www.oecd.org/dac/stats/idsonline. World Bank imports of good and services estimates are used for the denominator.
Categories, topics:
Aid Effectiveness
Last updated:
apr 23, 2017
Indicators value changes by year
Maximum:
32.398
jan 1, 1991
At the date of observation
Value
Absolute change
Change from previous value
jan 1, 1975
5.572
+5.572
0.0%
jan 1, 1976
10.515
+4.943
88.73%
jan 1, 1977
6.712
-3.803
-36.17%
jan 1, 1978
7.613
+0.901
13.42%
jan 1, 1979
10.427
+2.814
36.96%
jan 1, 1980
9.004
-1.423
-13.65%
jan 1, 1981
7.848
-1.156
-12.83%
jan 1, 1982
8.828
+0.979
12.48%
jan 1, 1983
15.133
+6.306
71.43%
jan 1, 1984
17.604
+2.471
16.33%
jan 1, 1985
22.664
+5.06
28.74%
jan 1, 1986
20.904
-1.76
-7.77%
jan 1, 1987
21.49
+0.587
2.81%
jan 1, 1988
19.182
-2.309
-10.74%
jan 1, 1989
23.043
+3.861
20.13%
jan 1, 1990
17.498
-5.545
-24.06%
jan 1, 1991
32.398
+14.901
85.16%
jan 1, 1992
21.17
-11.228
-34.66%
jan 1, 1993
23.68
+2.51
11.86%
jan 1, 1994
19.623
-4.057
-17.13%
jan 1, 1995
15.39
-4.233
-21.57%
jan 1, 1996
19.066
+3.675
23.88%
jan 1, 1997
13.986
-5.08
-26.64%
jan 1, 1998
10.611
-3.375
-24.13%
jan 1, 1999
10.269
-0.342
-3.22%
jan 1, 2000
25.113
+14.844
144.55%
jan 1, 2001
11.987
-13.126
-52.27%
jan 1, 2002
17.046
+5.058
42.2%
jan 1, 2003
10.822
-6.223
-36.51%
jan 1, 2004
9.022
-1.801
-16.64%
jan 1, 2005
12.475
+3.454
38.28%
jan 1, 2006
11.47
-1.006
-8.06%
jan 1, 2007
8.503
-2.967
-25.86%
jan 1, 2008
5.509
-2.994
-35.21%
jan 1, 2009
5.578
+0.069
1.26%
jan 1, 2010
6.07
+0.492
8.82%
jan 1, 2011
7.401
+1.331
21.92%
jan 1, 2012
5.715
-1.686
-22.78%
jan 1, 2013
4.9
-0.815
-14.26%
jan 1, 2014
5.467
+0.567
11.57%
jan 1, 2015
5.179
-0.288
-5.27%
Ranking of countries by current statistics by years


Comments: