29
/
en
AIzaSyAYiBZKx7MnpbEhh9jyipgxe19OcubqV5w
April 1, 2024
157678
Iran, Islamic Rep.
IRN
true
2
1
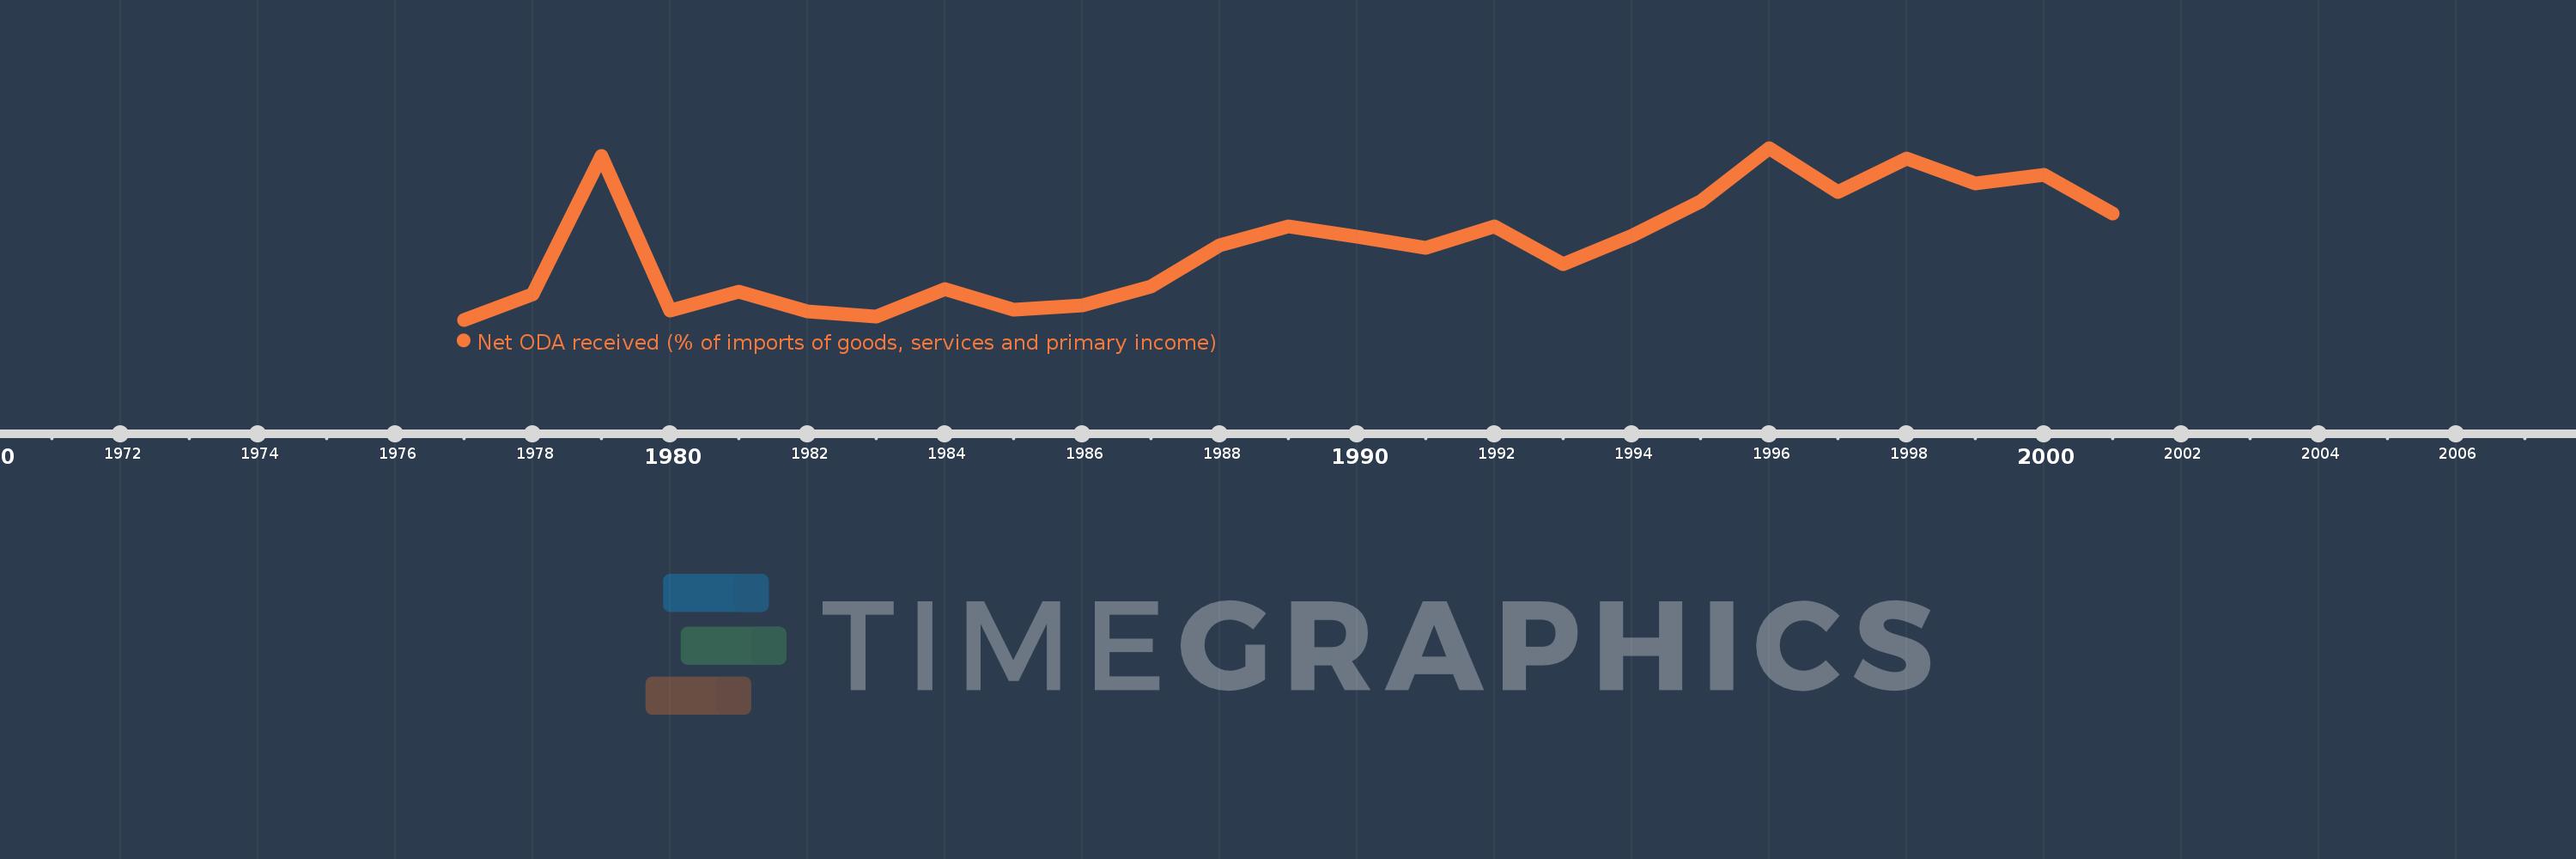
Net ODA received (% of imports of goods, services and primary income)
2001,2000,1999,1998,1997,1996,1995,1994,1993,1992,1991,1990,1989,1988,1987,1986,1985,1984,1983,1982,1981,1980,1979,1978,1977
This statistics in other country:
AfghanistanAlbaniaAlgeriaAngolaAntigua and BarbudaArab WorldArgentinaArmeniaArubaAzerbaijanBahamas, TheBahrainBangladeshBarbadosBelarusBelizeBeninBhutanBoliviaBosnia and HerzegovinaBotswanaBrazilBurkina FasoBurundiCabo VerdeCambodiaCameroonCaribbean small statesCentral African RepublicCentral Europe and the BalticsChadChileChinaColombiaComorosCongo, Dem. Rep.Congo, Rep.Costa RicaCote d'IvoireCroatiaCyprusDjiboutiDominicaDominican RepublicEast Asia & PacificEast Asia & Pacific (excluding high income)East Asia & Pacific (IDA & IBRD countries)EcuadorEgypt, Arab Rep.El SalvadorEquatorial GuineaEritreaEthiopiaEuro areaEurope & Central AsiaEurope & Central Asia (excluding high income)Europe & Central Asia (IDA & IBRD countries)European UnionFijiFragile and conflict affected situationsGabonGambia, TheGeorgiaGhanaGrenadaGuatemalaGuineaGuinea-BissauGuyanaHaitiHeavily indebted poor countries (HIPC)High incomeHondurasIBRD onlyIDA & IBRD totalIDA blendIDA onlyIDA totalIndiaIndonesiaIran, Islamic Rep.IraqIsraelJamaicaJordanKazakhstanKenyaKiribatiKorea, Rep.KosovoKuwaitKyrgyz RepublicLao PDRLatin America & Caribbean Latin America & Caribbean (excluding high income)Latin America & the Caribbean (IDA & IBRD countries)Least developed countries: UN classificationLebanonLesothoLiberiaLibyaLow & middle incomeLow incomeLower middle incomeMacedonia, FYRMadagascarMalawiMalaysiaMaldivesMaliMaltaMarshall IslandsMauritaniaMauritiusMexicoMicronesia, Fed. Sts.Middle East & North Africa (excluding high income)Middle East & North Africa (IDA & IBRD countries)Middle incomeMoldovaMongoliaMontenegroMoroccoMozambiqueMyanmarNamibiaNepalNicaraguaNigerNigeriaNorth AmericaOECD membersOmanOther small statesPacific island small statesPakistanPalauPanamaPapua New GuineaParaguayPeruPhilippinesRwandaSamoaSao Tome and PrincipeSaudi ArabiaSenegalSerbiaSeychellesSierra LeoneSingaporeSloveniaSmall statesSolomon IslandsSouth AfricaSouth AsiaSouth Asia (IDA & IBRD)South SudanSri LankaSt. Kitts and NevisSt. LuciaSt. Vincent and the GrenadinesSub-Saharan Africa Sub-Saharan Africa (excluding high income)Sub-Saharan Africa (IDA & IBRD countries)SudanSurinameSwazilandSyrian Arab RepublicTajikistanTanzaniaThailandTimor-LesteTogoTongaTrinidad and TobagoTunisiaTurkeyTuvaluUgandaUkraineUpper middle incomeUruguayVanuatuVenezuela, RBVietnamWest Bank and GazaWorldYemen, Rep.ZambiaZimbabwe Timeline:
This timeline shows a graph from 1977 to 2001 of Iran, Islamic Rep.. No data until 1976. Number of actual observations by date: 25.
Source name:
World Development Indicators
Source organization:
Development Assistance Committee of the Organisation for Economic Co-operation and Development, Geographical Distribution of Financial Flows to Developing Countries, Development Co-operation Report, and International Development Statistics database. Data are available online at: www.oecd.org/dac/stats/idsonline. World Bank imports of good and services estimates are used for the denominator.
Categories, topics:
Aid Effectiveness
Last updated:
apr 23, 2017
Indicators value changes by year
Minimum:
-0.027
jan 1, 1977
At the date of observation
Value
Absolute change
Change from previous value
jan 1, 1977
-0.027
-0.027
0.0%
jan 1, 1978
0.151
+0.178
-661.92%
jan 1, 1979
1.117
+0.966
639.14%
jan 1, 1980
0.039
-1.078
-96.52%
jan 1, 1981
0.171
+0.132
338.35%
jan 1, 1982
0.029
-0.142
-83.04%
jan 1, 1983
-0.004
-0.033
-113.75%
jan 1, 1984
0.19
+0.194
-4.88K%
jan 1, 1985
0.042
-0.148
-77.89%
jan 1, 1986
0.074
+0.032
76.54%
jan 1, 1987
0.203
+0.129
174.34%
jan 1, 1988
0.491
+0.287
141.24%
jan 1, 1989
0.623
+0.133
27.04%
jan 1, 1990
0.551
-0.073
-11.63%
jan 1, 1991
0.476
-0.075
-13.63%
jan 1, 1992
0.624
+0.148
31.15%
jan 1, 1993
0.362
-0.262
-42.02%
jan 1, 1994
0.56
+0.198
54.68%
jan 1, 1995
0.797
+0.238
42.5%
jan 1, 1996
1.173
+0.375
47.05%
jan 1, 1997
0.865
-0.308
-26.23%
jan 1, 1998
1.098
+0.233
26.98%
jan 1, 1999
0.924
-0.174
-15.85%
jan 1, 2000
0.986
+0.061
6.61%
jan 1, 2001
0.717
-0.268
-27.22%
Ranking of countries by current statistics by years


Comments: