29
/
en
AIzaSyAYiBZKx7MnpbEhh9jyipgxe19OcubqV5w
April 1, 2024
215610
Oman
OMN
true
2
1
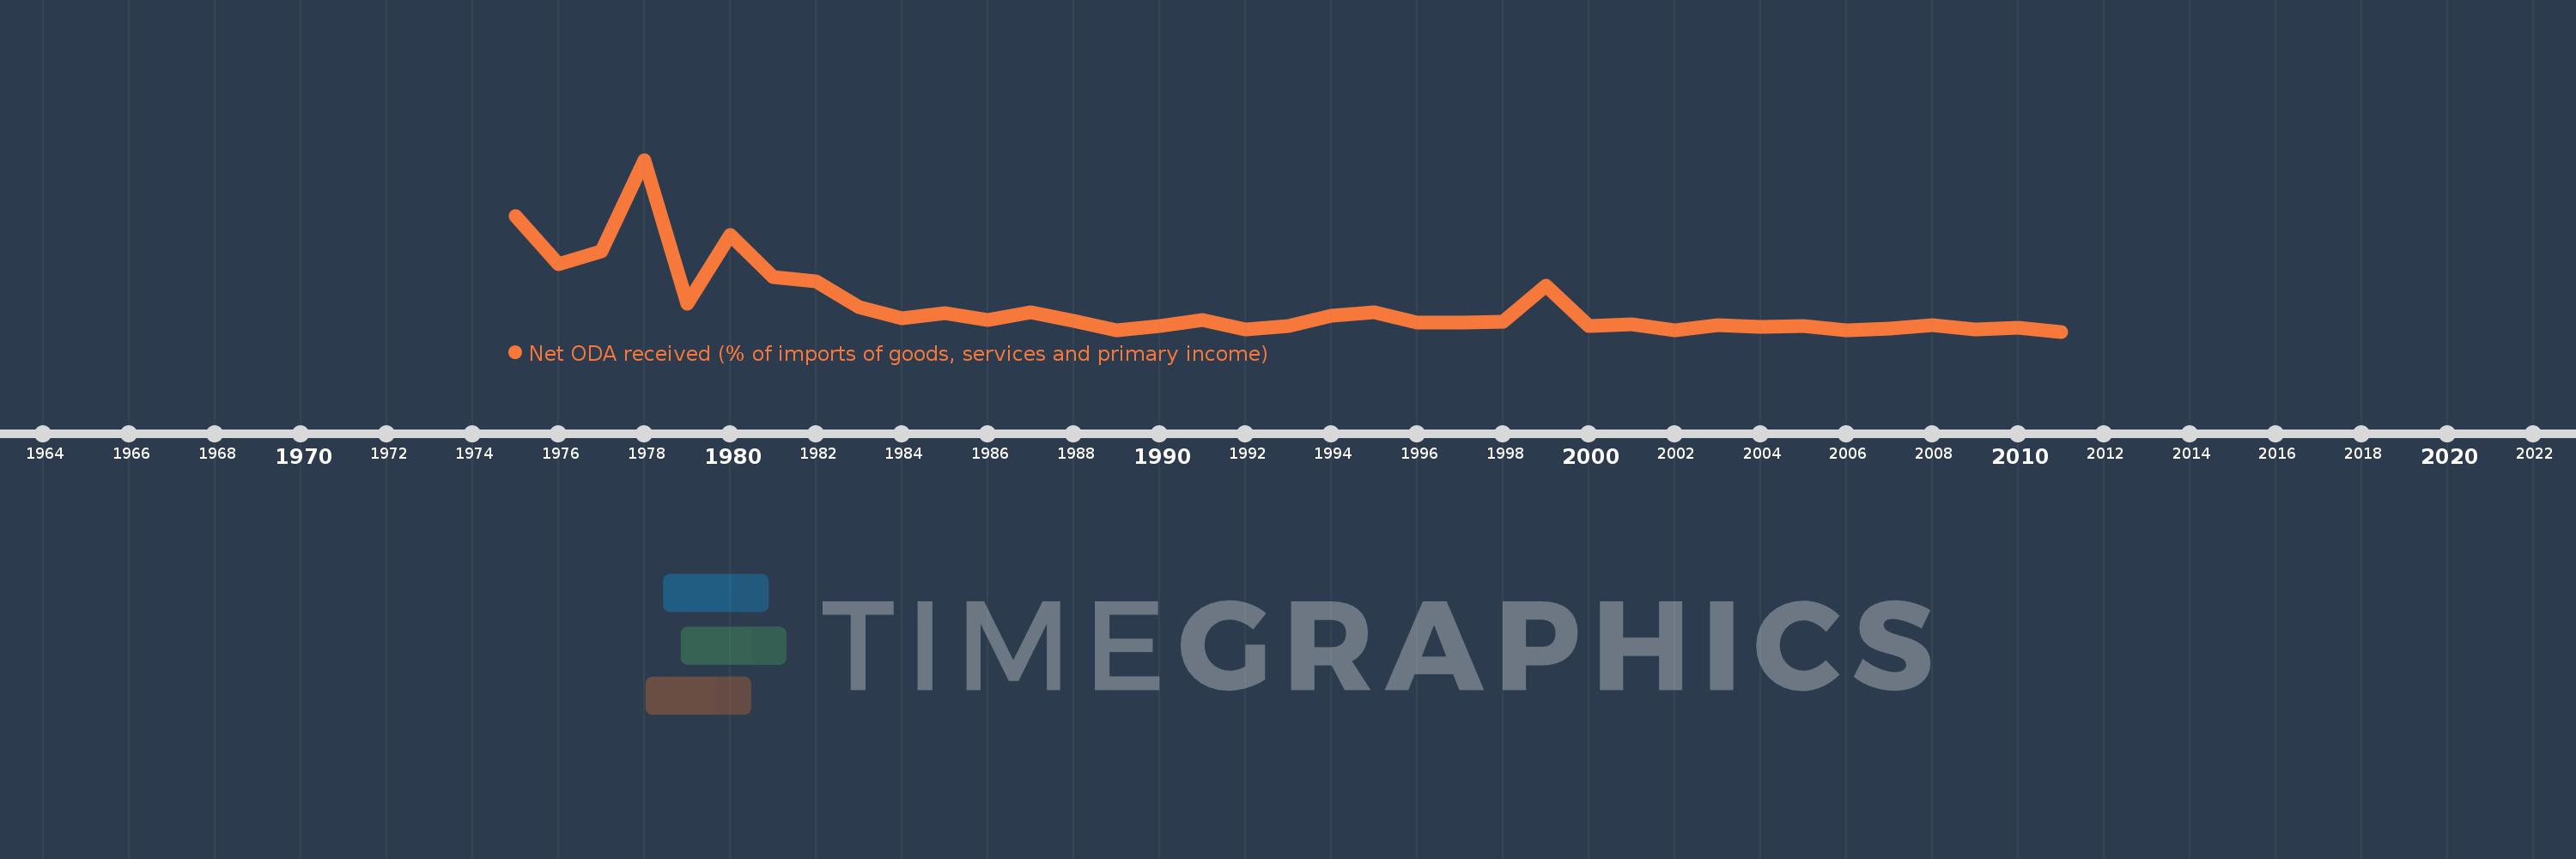
Net ODA received (% of imports of goods, services and primary income)
2011,2010,2009,2008,2007,2006,2005,2004,2003,2002,2001,2000,1999,1998,1997,1996,1995,1994,1993,1992,1991,1990,1989,1988,1987,1986,1985,1984,1983,1982,1981,1980,1979,1978,1977,1976,1975
This statistics in other country:
AfghanistanAlbaniaAlgeriaAngolaAntigua and BarbudaArab WorldArgentinaArmeniaArubaAzerbaijanBahamas, TheBahrainBangladeshBarbadosBelarusBelizeBeninBhutanBoliviaBosnia and HerzegovinaBotswanaBrazilBurkina FasoBurundiCabo VerdeCambodiaCameroonCaribbean small statesCentral African RepublicCentral Europe and the BalticsChadChileChinaColombiaComorosCongo, Dem. Rep.Congo, Rep.Costa RicaCote d'IvoireCroatiaCyprusDjiboutiDominicaDominican RepublicEast Asia & PacificEast Asia & Pacific (excluding high income)East Asia & Pacific (IDA & IBRD countries)EcuadorEgypt, Arab Rep.El SalvadorEquatorial GuineaEritreaEthiopiaEuro areaEurope & Central AsiaEurope & Central Asia (excluding high income)Europe & Central Asia (IDA & IBRD countries)European UnionFijiFragile and conflict affected situationsGabonGambia, TheGeorgiaGhanaGrenadaGuatemalaGuineaGuinea-BissauGuyanaHaitiHeavily indebted poor countries (HIPC)High incomeHondurasIBRD onlyIDA & IBRD totalIDA blendIDA onlyIDA totalIndiaIndonesiaIran, Islamic Rep.IraqIsraelJamaicaJordanKazakhstanKenyaKiribatiKorea, Rep.KosovoKuwaitKyrgyz RepublicLao PDRLatin America & Caribbean Latin America & Caribbean (excluding high income)Latin America & the Caribbean (IDA & IBRD countries)Least developed countries: UN classificationLebanonLesothoLiberiaLibyaLow & middle incomeLow incomeLower middle incomeMacedonia, FYRMadagascarMalawiMalaysiaMaldivesMaliMaltaMarshall IslandsMauritaniaMauritiusMexicoMicronesia, Fed. Sts.Middle East & North Africa (excluding high income)Middle East & North Africa (IDA & IBRD countries)Middle incomeMoldovaMongoliaMontenegroMoroccoMozambiqueMyanmarNamibiaNepalNicaraguaNigerNigeriaNorth AmericaOECD membersOmanOther small statesPacific island small statesPakistanPalauPanamaPapua New GuineaParaguayPeruPhilippinesRwandaSamoaSao Tome and PrincipeSaudi ArabiaSenegalSerbiaSeychellesSierra LeoneSingaporeSloveniaSmall statesSolomon IslandsSouth AfricaSouth AsiaSouth Asia (IDA & IBRD)South SudanSri LankaSt. Kitts and NevisSt. LuciaSt. Vincent and the GrenadinesSub-Saharan Africa Sub-Saharan Africa (excluding high income)Sub-Saharan Africa (IDA & IBRD countries)SudanSurinameSwazilandSyrian Arab RepublicTajikistanTanzaniaThailandTimor-LesteTogoTongaTrinidad and TobagoTunisiaTurkeyTuvaluUgandaUkraineUpper middle incomeUruguayVanuatuVenezuela, RBVietnamWest Bank and GazaWorldYemen, Rep.ZambiaZimbabwe Timeline:
This timeline shows a graph from 1975 to 2011 of Oman. No data until 1974. Number of actual observations by date: 37.
Source name:
World Development Indicators
Source organization:
Development Assistance Committee of the Organisation for Economic Co-operation and Development, Geographical Distribution of Financial Flows to Developing Countries, Development Co-operation Report, and International Development Statistics database. Data are available online at: www.oecd.org/dac/stats/idsonline. World Bank imports of good and services estimates are used for the denominator.
Categories, topics:
Aid Effectiveness
Last updated:
apr 23, 2017
Indicators value changes by year
Minimum:
-0.076
jan 1, 2011
Maximum:
26.144
jan 1, 1978
At the date of observation
Value
Absolute change
Change from previous value
jan 1, 1975
17.574
+17.574
0.0%
jan 1, 1976
10.194
-7.38
-41.99%
jan 1, 1977
12.199
+2.005
19.66%
jan 1, 1978
26.144
+13.946
114.32%
jan 1, 1979
4.129
-22.015
-84.21%
jan 1, 1980
14.609
+10.48
253.82%
jan 1, 1981
8.277
-6.333
-43.35%
jan 1, 1982
7.564
-0.713
-8.62%
jan 1, 1983
3.636
-3.927
-51.92%
jan 1, 1984
2.013
-1.623
-44.64%
jan 1, 1985
2.749
+0.736
36.55%
jan 1, 1986
1.752
-0.997
-36.26%
jan 1, 1987
2.833
+1.081
61.71%
jan 1, 1988
1.571
-1.262
-44.55%
jan 1, 1989
0.159
-1.412
-89.86%
jan 1, 1990
0.73
+0.57
358.0%
jan 1, 1991
1.718
+0.988
135.41%
jan 1, 1992
0.28
-1.437
-83.67%
jan 1, 1993
0.748
+0.468
166.77%
jan 1, 1994
2.306
+1.558
208.24%
jan 1, 1995
2.924
+0.618
26.81%
jan 1, 1996
1.31
-1.614
-55.21%
jan 1, 1997
1.326
+0.017
1.29%
jan 1, 1998
1.439
+0.113
8.5%
jan 1, 1999
6.996
+5.557
386.1%
jan 1, 2000
0.775
-6.221
-88.92%
jan 1, 2001
1.065
+0.29
37.43%
jan 1, 2002
0.099
-0.966
-90.68%
jan 1, 2003
0.914
+0.814
820.41%
jan 1, 2004
0.676
-0.238
-26.02%
jan 1, 2005
0.828
+0.152
22.48%
jan 1, 2006
0.147
-0.681
-82.25%
jan 1, 2007
0.334
+0.187
127.38%
jan 1, 2008
0.955
+0.621
185.92%
jan 1, 2009
0.245
-0.71
-74.32%
jan 1, 2010
0.573
+0.328
133.76%
jan 1, 2011
-0.076
-0.649
-113.18%
Ranking of countries by current statistics by years


Comments: