29
/
en
AIzaSyAYiBZKx7MnpbEhh9jyipgxe19OcubqV5w
April 1, 2024
178004
Lesotho
LSO
true
2
1
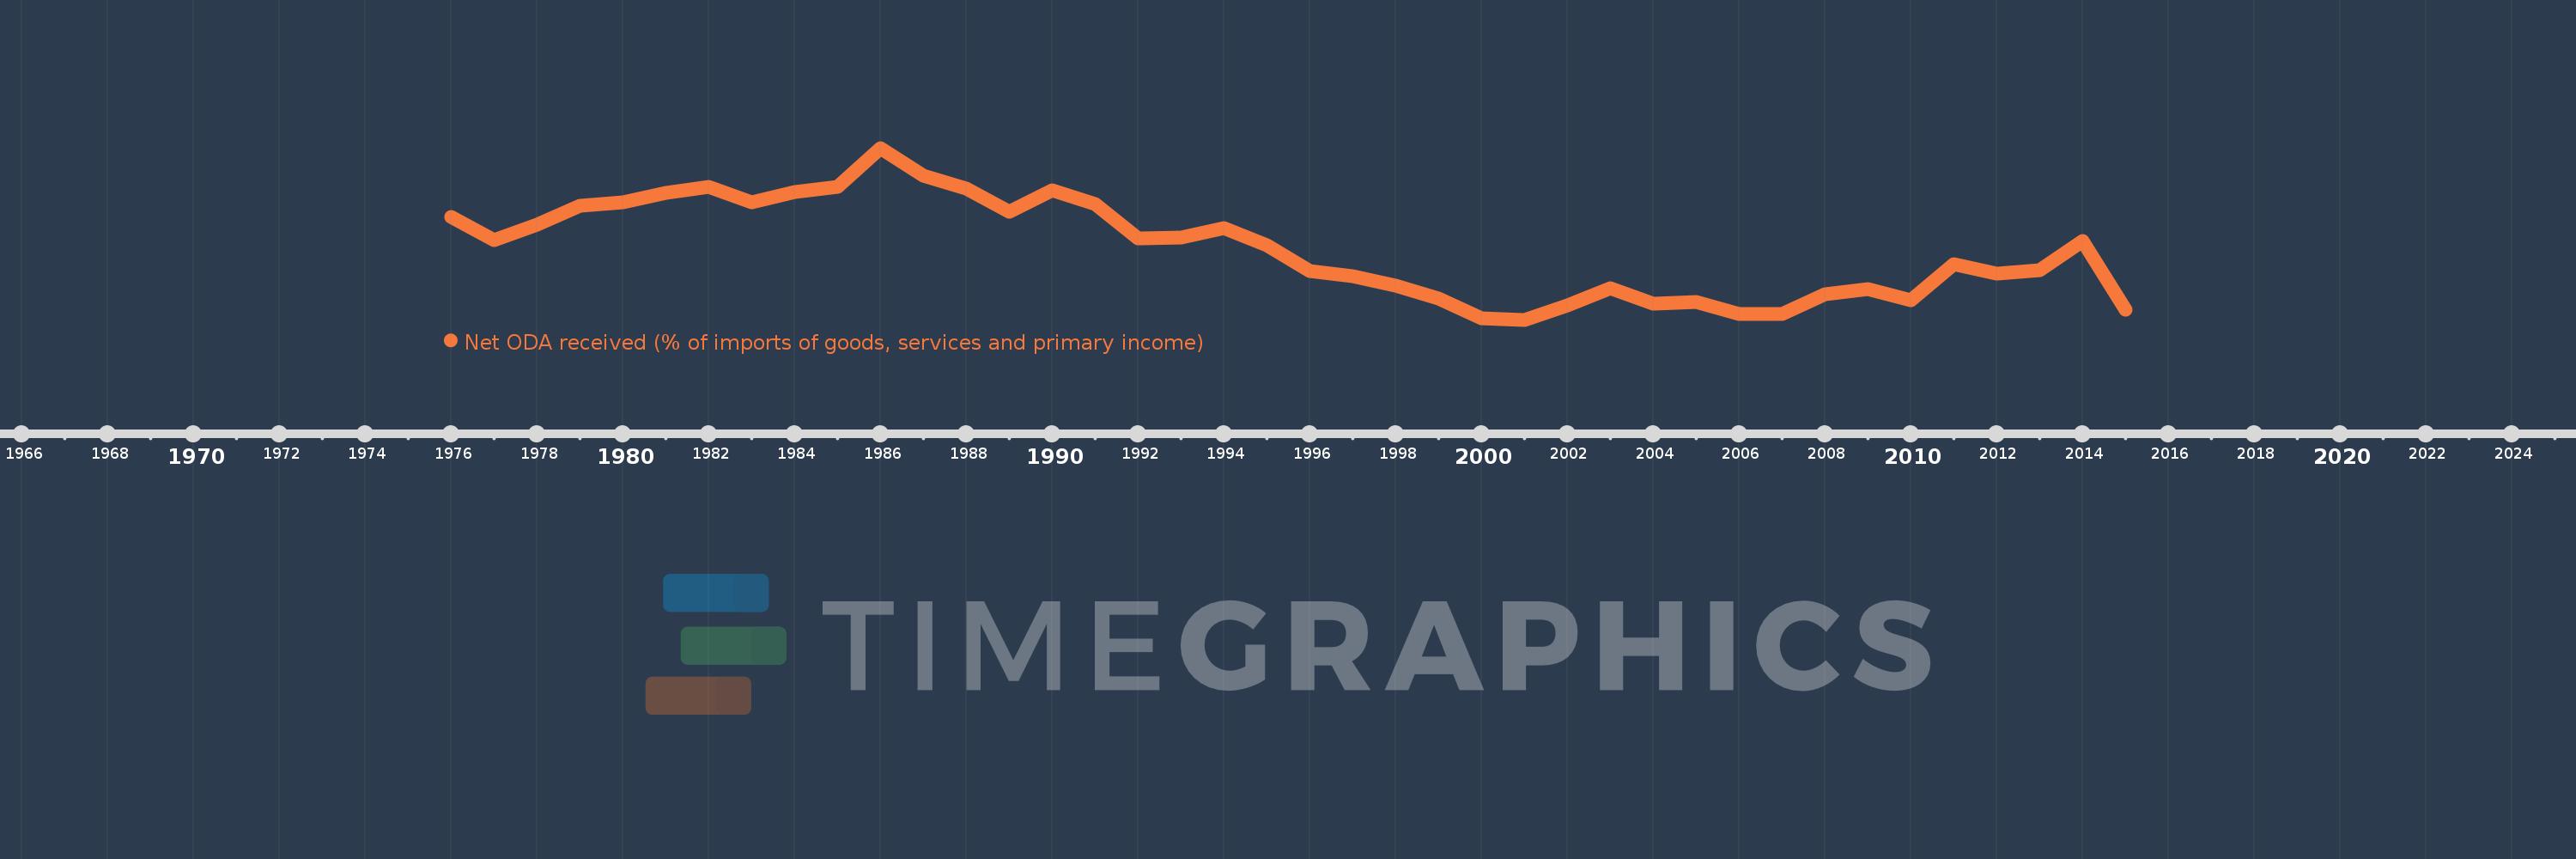
Net ODA received (% of imports of goods, services and primary income)
2015,2014,2013,2012,2011,2010,2009,2008,2007,2006,2005,2004,2003,2002,2001,2000,1999,1998,1997,1996,1995,1994,1993,1992,1991,1990,1989,1988,1987,1986,1985,1984,1983,1982,1981,1980,1979,1978,1977,1976
This statistics in other country:
AfghanistanAlbaniaAlgeriaAngolaAntigua and BarbudaArab WorldArgentinaArmeniaArubaAzerbaijanBahamas, TheBahrainBangladeshBarbadosBelarusBelizeBeninBhutanBoliviaBosnia and HerzegovinaBotswanaBrazilBurkina FasoBurundiCabo VerdeCambodiaCameroonCaribbean small statesCentral African RepublicCentral Europe and the BalticsChadChileChinaColombiaComorosCongo, Dem. Rep.Congo, Rep.Costa RicaCote d'IvoireCroatiaCyprusDjiboutiDominicaDominican RepublicEast Asia & PacificEast Asia & Pacific (excluding high income)East Asia & Pacific (IDA & IBRD countries)EcuadorEgypt, Arab Rep.El SalvadorEquatorial GuineaEritreaEthiopiaEuro areaEurope & Central AsiaEurope & Central Asia (excluding high income)Europe & Central Asia (IDA & IBRD countries)European UnionFijiFragile and conflict affected situationsGabonGambia, TheGeorgiaGhanaGrenadaGuatemalaGuineaGuinea-BissauGuyanaHaitiHeavily indebted poor countries (HIPC)High incomeHondurasIBRD onlyIDA & IBRD totalIDA blendIDA onlyIDA totalIndiaIndonesiaIran, Islamic Rep.IraqIsraelJamaicaJordanKazakhstanKenyaKiribatiKorea, Rep.KosovoKuwaitKyrgyz RepublicLao PDRLatin America & Caribbean Latin America & Caribbean (excluding high income)Latin America & the Caribbean (IDA & IBRD countries)Least developed countries: UN classificationLebanonLesothoLiberiaLibyaLow & middle incomeLow incomeLower middle incomeMacedonia, FYRMadagascarMalawiMalaysiaMaldivesMaliMaltaMarshall IslandsMauritaniaMauritiusMexicoMicronesia, Fed. Sts.Middle East & North Africa (excluding high income)Middle East & North Africa (IDA & IBRD countries)Middle incomeMoldovaMongoliaMontenegroMoroccoMozambiqueMyanmarNamibiaNepalNicaraguaNigerNigeriaNorth AmericaOECD membersOmanOther small statesPacific island small statesPakistanPalauPanamaPapua New GuineaParaguayPeruPhilippinesRwandaSamoaSao Tome and PrincipeSaudi ArabiaSenegalSerbiaSeychellesSierra LeoneSingaporeSloveniaSmall statesSolomon IslandsSouth AfricaSouth AsiaSouth Asia (IDA & IBRD)South SudanSri LankaSt. Kitts and NevisSt. LuciaSt. Vincent and the GrenadinesSub-Saharan Africa Sub-Saharan Africa (excluding high income)Sub-Saharan Africa (IDA & IBRD countries)SudanSurinameSwazilandSyrian Arab RepublicTajikistanTanzaniaThailandTimor-LesteTogoTongaTrinidad and TobagoTunisiaTurkeyTuvaluUgandaUkraineUpper middle incomeUruguayVanuatuVenezuela, RBVietnamWest Bank and GazaWorldYemen, Rep.ZambiaZimbabwe Timeline:
This timeline shows a graph from 1976 to 2015 of Lesotho. No data until 1975. Number of actual observations by date: 40.
Source name:
World Development Indicators
Source organization:
Development Assistance Committee of the Organisation for Economic Co-operation and Development, Geographical Distribution of Financial Flows to Developing Countries, Development Co-operation Report, and International Development Statistics database. Data are available online at: www.oecd.org/dac/stats/idsonline. World Bank imports of good and services estimates are used for the denominator.
Categories, topics:
Aid Effectiveness
Last updated:
apr 23, 2017
Indicators value changes by year
Maximum:
25.013
jan 1, 1986
At the date of observation
Value
Absolute change
Change from previous value
jan 1, 1976
16.276
+16.276
0.0%
jan 1, 1977
13.298
-2.978
-18.3%
jan 1, 1978
15.235
+1.937
14.57%
jan 1, 1979
17.725
+2.49
16.34%
jan 1, 1980
18.072
+0.347
1.96%
jan 1, 1981
19.312
+1.24
6.86%
jan 1, 1982
20.13
+0.818
4.23%
jan 1, 1983
18.153
-1.977
-9.82%
jan 1, 1984
19.475
+1.322
7.28%
jan 1, 1985
20.119
+0.644
3.31%
jan 1, 1986
25.013
+4.894
24.32%
jan 1, 1987
21.449
-3.563
-14.25%
jan 1, 1988
19.887
-1.562
-7.28%
jan 1, 1989
16.926
-2.961
-14.89%
jan 1, 1990
19.671
+2.746
16.22%
jan 1, 1991
17.931
-1.74
-8.85%
jan 1, 1992
13.581
-4.35
-24.26%
jan 1, 1993
13.661
+0.08
0.59%
jan 1, 1994
14.881
+1.22
8.93%
jan 1, 1995
12.652
-2.229
-14.98%
jan 1, 1996
9.358
-3.294
-26.04%
jan 1, 1997
8.791
-0.567
-6.06%
jan 1, 1998
7.599
-1.192
-13.56%
jan 1, 1999
5.872
-1.727
-22.73%
jan 1, 2000
3.409
-2.462
-41.93%
jan 1, 2001
3.227
-0.183
-5.36%
jan 1, 2002
5.077
+1.85
57.35%
jan 1, 2003
7.252
+2.175
42.84%
jan 1, 2004
5.242
-2.01
-27.71%
jan 1, 2005
5.454
+0.211
4.03%
jan 1, 2006
3.965
-1.489
-27.3%
jan 1, 2007
3.932
-0.033
-0.84%
jan 1, 2008
6.476
+2.544
64.71%
jan 1, 2009
7.067
+0.591
9.13%
jan 1, 2010
5.723
-1.344
-19.02%
jan 1, 2011
10.239
+4.516
78.9%
jan 1, 2012
9.036
-1.202
-11.74%
jan 1, 2013
9.504
+0.467
5.17%
jan 1, 2014
13.185
+3.681
38.73%
jan 1, 2015
4.491
-8.693
-65.93%
Ranking of countries by current statistics by years


Comments: