29
/
en
AIzaSyAYiBZKx7MnpbEhh9jyipgxe19OcubqV5w
April 1, 2024
238560
Seychelles
SYC
true
2
1
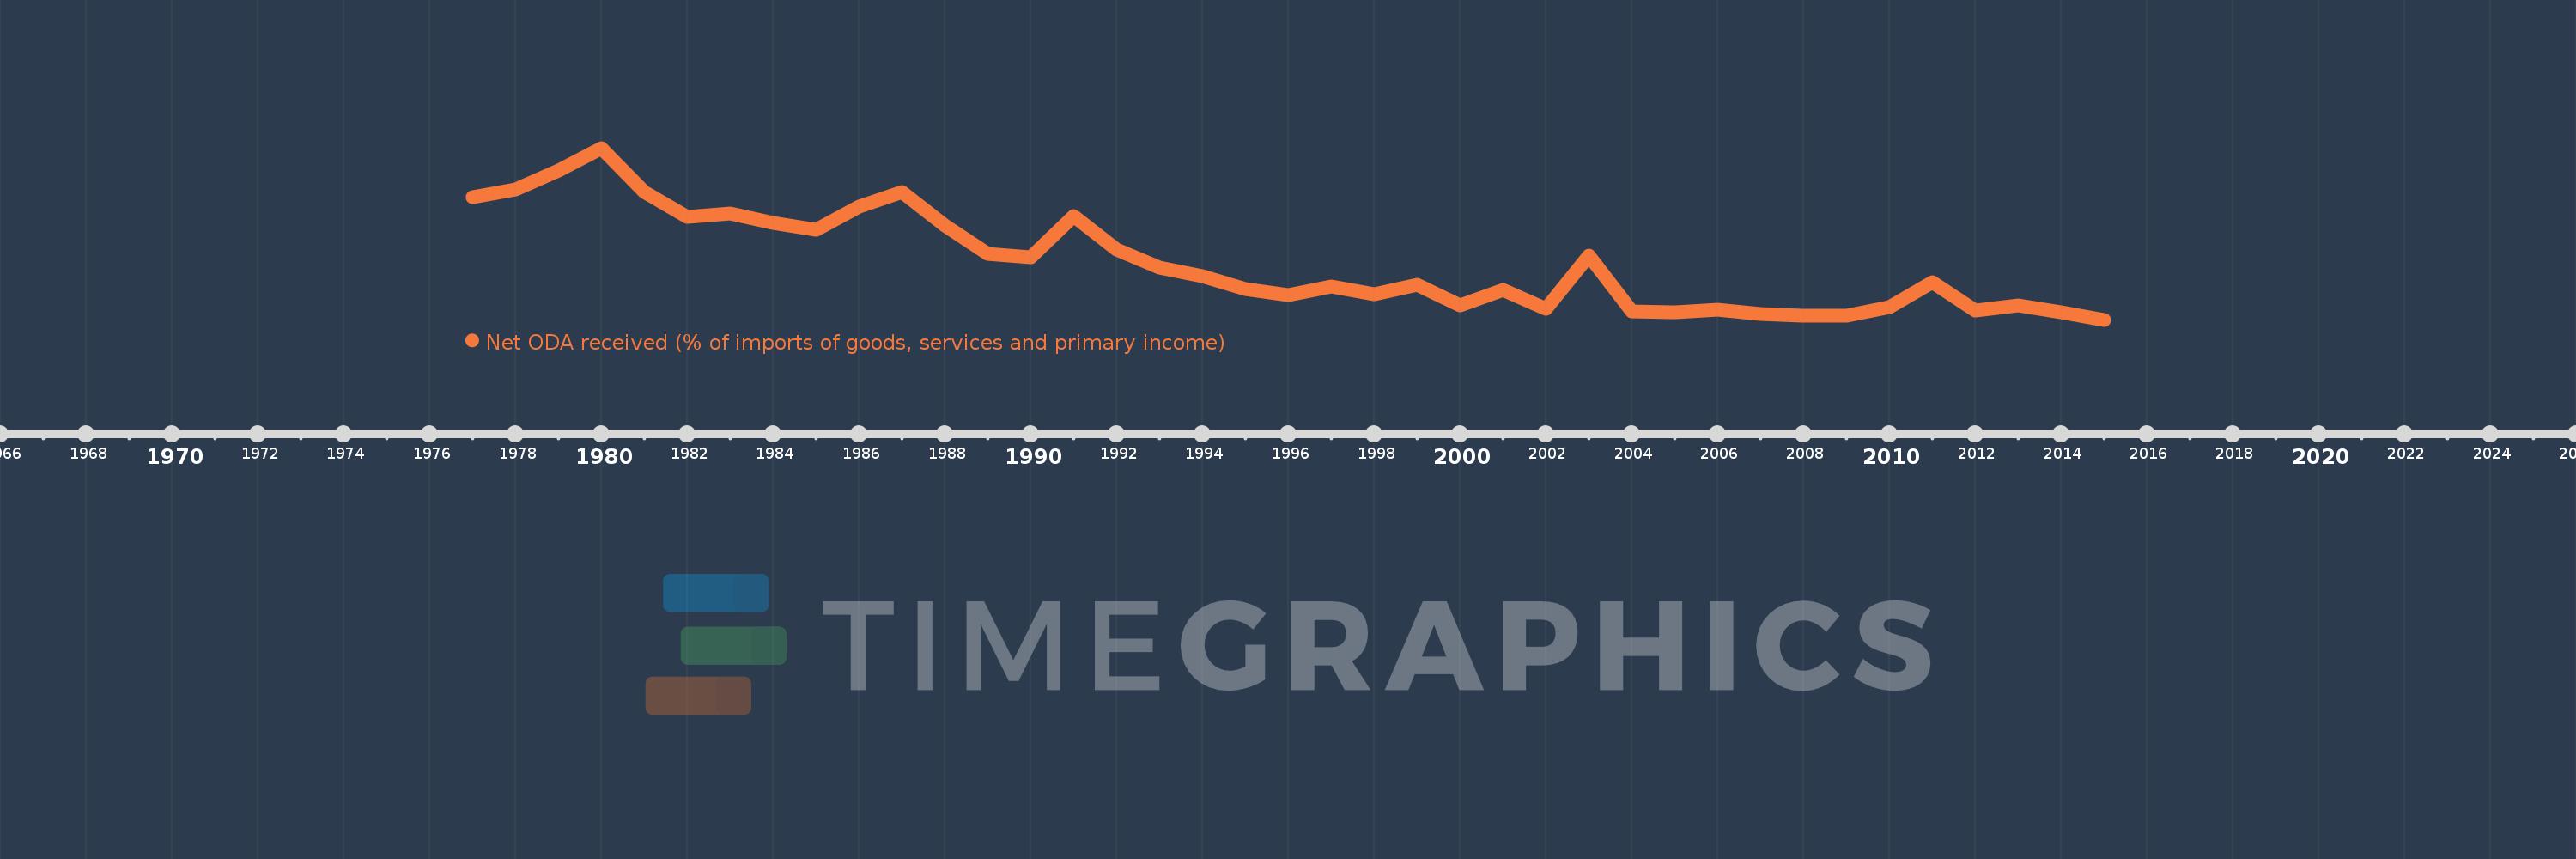
Net ODA received (% of imports of goods, services and primary income)
2015,2014,2013,2012,2011,2010,2009,2008,2007,2006,2005,2004,2003,2002,2001,2000,1999,1998,1997,1996,1995,1994,1993,1992,1991,1990,1989,1988,1987,1986,1985,1984,1983,1982,1981,1980,1979,1978,1977
This statistics in other country:
AfghanistanAlbaniaAlgeriaAngolaAntigua and BarbudaArab WorldArgentinaArmeniaArubaAzerbaijanBahamas, TheBahrainBangladeshBarbadosBelarusBelizeBeninBhutanBoliviaBosnia and HerzegovinaBotswanaBrazilBurkina FasoBurundiCabo VerdeCambodiaCameroonCaribbean small statesCentral African RepublicCentral Europe and the BalticsChadChileChinaColombiaComorosCongo, Dem. Rep.Congo, Rep.Costa RicaCote d'IvoireCroatiaCyprusDjiboutiDominicaDominican RepublicEast Asia & PacificEast Asia & Pacific (excluding high income)East Asia & Pacific (IDA & IBRD countries)EcuadorEgypt, Arab Rep.El SalvadorEquatorial GuineaEritreaEthiopiaEuro areaEurope & Central AsiaEurope & Central Asia (excluding high income)Europe & Central Asia (IDA & IBRD countries)European UnionFijiFragile and conflict affected situationsGabonGambia, TheGeorgiaGhanaGrenadaGuatemalaGuineaGuinea-BissauGuyanaHaitiHeavily indebted poor countries (HIPC)High incomeHondurasIBRD onlyIDA & IBRD totalIDA blendIDA onlyIDA totalIndiaIndonesiaIran, Islamic Rep.IraqIsraelJamaicaJordanKazakhstanKenyaKiribatiKorea, Rep.KosovoKuwaitKyrgyz RepublicLao PDRLatin America & Caribbean Latin America & Caribbean (excluding high income)Latin America & the Caribbean (IDA & IBRD countries)Least developed countries: UN classificationLebanonLesothoLiberiaLibyaLow & middle incomeLow incomeLower middle incomeMacedonia, FYRMadagascarMalawiMalaysiaMaldivesMaliMaltaMarshall IslandsMauritaniaMauritiusMexicoMicronesia, Fed. Sts.Middle East & North Africa (excluding high income)Middle East & North Africa (IDA & IBRD countries)Middle incomeMoldovaMongoliaMontenegroMoroccoMozambiqueMyanmarNamibiaNepalNicaraguaNigerNigeriaNorth AmericaOECD membersOmanOther small statesPacific island small statesPakistanPalauPanamaPapua New GuineaParaguayPeruPhilippinesRwandaSamoaSao Tome and PrincipeSaudi ArabiaSenegalSerbiaSeychellesSierra LeoneSingaporeSloveniaSmall statesSolomon IslandsSouth AfricaSouth AsiaSouth Asia (IDA & IBRD)South SudanSri LankaSt. Kitts and NevisSt. LuciaSt. Vincent and the GrenadinesSub-Saharan Africa Sub-Saharan Africa (excluding high income)Sub-Saharan Africa (IDA & IBRD countries)SudanSurinameSwazilandSyrian Arab RepublicTajikistanTanzaniaThailandTimor-LesteTogoTongaTrinidad and TobagoTunisiaTurkeyTuvaluUgandaUkraineUpper middle incomeUruguayVanuatuVenezuela, RBVietnamWest Bank and GazaWorldYemen, Rep.ZambiaZimbabwe Timeline:
This timeline shows a graph from 1977 to 2015 of Seychelles. No data until 1976. Number of actual observations by date: 39.
Source name:
World Development Indicators
Source organization:
Development Assistance Committee of the Organisation for Economic Co-operation and Development, Geographical Distribution of Financial Flows to Developing Countries, Development Co-operation Report, and International Development Statistics database. Data are available online at: www.oecd.org/dac/stats/idsonline. World Bank imports of good and services estimates are used for the denominator.
Categories, topics:
Aid Effectiveness
Last updated:
apr 23, 2017
Indicators value changes by year
Maximum:
21.861
jan 1, 1980
At the date of observation
Value
Absolute change
Change from previous value
jan 1, 1977
15.794
+15.794
0.0%
jan 1, 1978
16.671
+0.877
5.55%
jan 1, 1979
19.093
+2.422
14.53%
jan 1, 1980
21.861
+2.768
14.5%
jan 1, 1981
16.357
-5.504
-25.18%
jan 1, 1982
13.297
-3.06
-18.71%
jan 1, 1983
13.758
+0.461
3.47%
jan 1, 1984
12.597
-1.161
-8.44%
jan 1, 1985
11.731
-0.866
-6.87%
jan 1, 1986
14.548
+2.816
24.01%
jan 1, 1987
16.362
+1.814
12.47%
jan 1, 1988
12.198
-4.164
-25.45%
jan 1, 1989
8.692
-3.506
-28.74%
jan 1, 1990
8.338
-0.354
-4.07%
jan 1, 1991
13.437
+5.099
61.15%
jan 1, 1992
9.226
-4.211
-31.34%
jan 1, 1993
7.03
-2.196
-23.8%
jan 1, 1994
6.017
-1.013
-14.41%
jan 1, 1995
4.412
-1.605
-26.68%
jan 1, 1996
3.666
-0.746
-16.9%
jan 1, 1997
4.649
+0.982
26.8%
jan 1, 1998
3.763
-0.885
-19.04%
jan 1, 1999
4.867
+1.103
29.32%
jan 1, 2000
2.315
-2.551
-52.43%
jan 1, 2001
4.237
+1.921
82.98%
jan 1, 2002
1.941
-2.296
-54.19%
jan 1, 2003
8.575
+6.635
341.86%
jan 1, 2004
1.559
-7.016
-81.82%
jan 1, 2005
1.448
-0.111
-7.1%
jan 1, 2006
1.79
+0.341
23.56%
jan 1, 2007
1.314
-0.476
-26.61%
jan 1, 2008
1.079
-0.234
-17.85%
jan 1, 2009
1.075
-0.004
-0.36%
jan 1, 2010
2.168
+1.093
101.61%
jan 1, 2011
5.24
+3.072
141.72%
jan 1, 2012
1.753
-3.487
-66.55%
jan 1, 2013
2.312
+0.559
31.88%
jan 1, 2014
1.529
-0.783
-33.85%
jan 1, 2015
0.571
-0.958
-62.65%
Ranking of countries by current statistics by years


Comments: