29
/
en
AIzaSyAYiBZKx7MnpbEhh9jyipgxe19OcubqV5w
April 1, 2024
191730
Malta
MLT
true
2
1
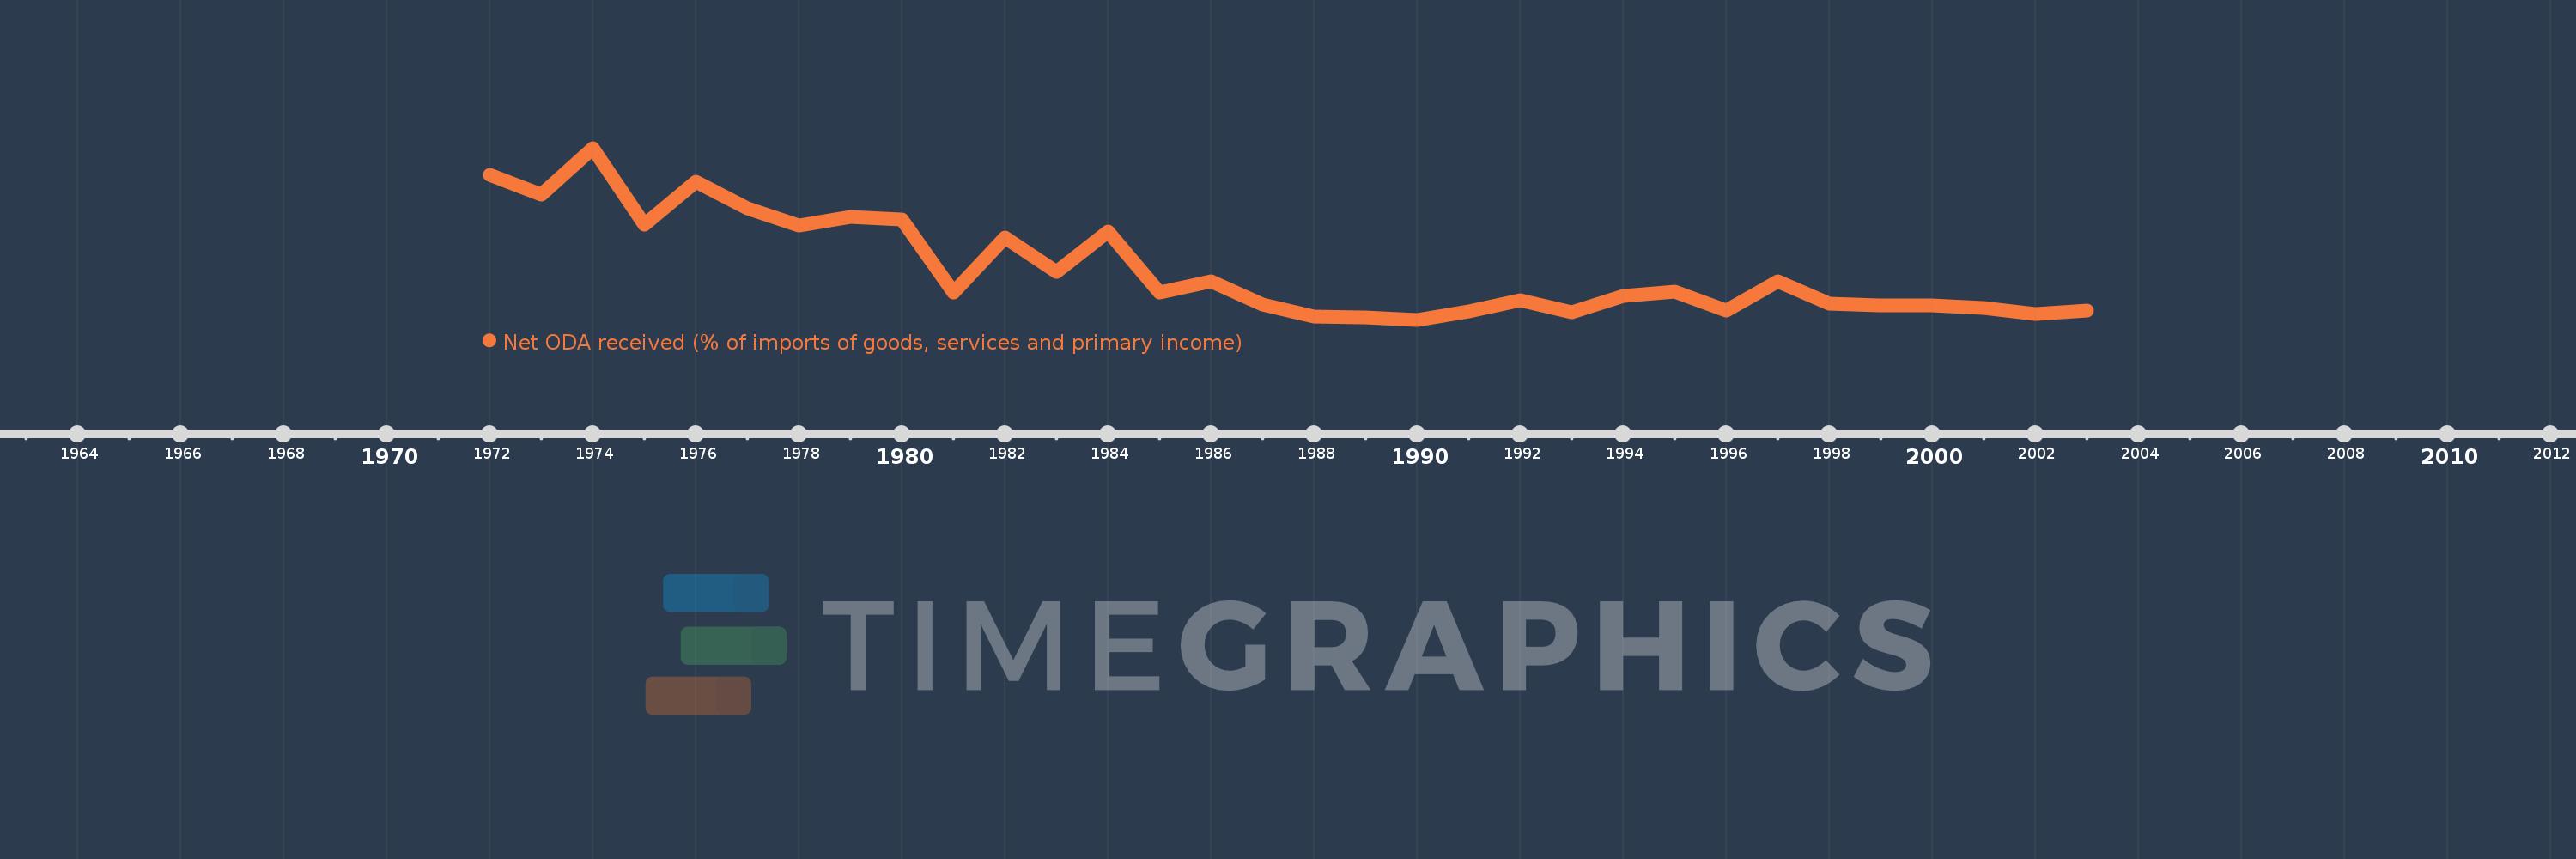
Net ODA received (% of imports of goods, services and primary income)
2003,2002,2001,2000,1999,1998,1997,1996,1995,1994,1993,1992,1991,1990,1989,1988,1987,1986,1985,1984,1983,1982,1981,1980,1979,1978,1977,1976,1975,1974,1973,1972
This statistics in other country:
AfghanistanAlbaniaAlgeriaAngolaAntigua and BarbudaArab WorldArgentinaArmeniaArubaAzerbaijanBahamas, TheBahrainBangladeshBarbadosBelarusBelizeBeninBhutanBoliviaBosnia and HerzegovinaBotswanaBrazilBurkina FasoBurundiCabo VerdeCambodiaCameroonCaribbean small statesCentral African RepublicCentral Europe and the BalticsChadChileChinaColombiaComorosCongo, Dem. Rep.Congo, Rep.Costa RicaCote d'IvoireCroatiaCyprusDjiboutiDominicaDominican RepublicEast Asia & PacificEast Asia & Pacific (excluding high income)East Asia & Pacific (IDA & IBRD countries)EcuadorEgypt, Arab Rep.El SalvadorEquatorial GuineaEritreaEthiopiaEuro areaEurope & Central AsiaEurope & Central Asia (excluding high income)Europe & Central Asia (IDA & IBRD countries)European UnionFijiFragile and conflict affected situationsGabonGambia, TheGeorgiaGhanaGrenadaGuatemalaGuineaGuinea-BissauGuyanaHaitiHeavily indebted poor countries (HIPC)High incomeHondurasIBRD onlyIDA & IBRD totalIDA blendIDA onlyIDA totalIndiaIndonesiaIran, Islamic Rep.IraqIsraelJamaicaJordanKazakhstanKenyaKiribatiKorea, Rep.KosovoKuwaitKyrgyz RepublicLao PDRLatin America & Caribbean Latin America & Caribbean (excluding high income)Latin America & the Caribbean (IDA & IBRD countries)Least developed countries: UN classificationLebanonLesothoLiberiaLibyaLow & middle incomeLow incomeLower middle incomeMacedonia, FYRMadagascarMalawiMalaysiaMaldivesMaliMaltaMarshall IslandsMauritaniaMauritiusMexicoMicronesia, Fed. Sts.Middle East & North Africa (excluding high income)Middle East & North Africa (IDA & IBRD countries)Middle incomeMoldovaMongoliaMontenegroMoroccoMozambiqueMyanmarNamibiaNepalNicaraguaNigerNigeriaNorth AmericaOECD membersOmanOther small statesPacific island small statesPakistanPalauPanamaPapua New GuineaParaguayPeruPhilippinesRwandaSamoaSao Tome and PrincipeSaudi ArabiaSenegalSerbiaSeychellesSierra LeoneSingaporeSloveniaSmall statesSolomon IslandsSouth AfricaSouth AsiaSouth Asia (IDA & IBRD)South SudanSri LankaSt. Kitts and NevisSt. LuciaSt. Vincent and the GrenadinesSub-Saharan Africa Sub-Saharan Africa (excluding high income)Sub-Saharan Africa (IDA & IBRD countries)SudanSurinameSwazilandSyrian Arab RepublicTajikistanTanzaniaThailandTimor-LesteTogoTongaTrinidad and TobagoTunisiaTurkeyTuvaluUgandaUkraineUpper middle incomeUruguayVanuatuVenezuela, RBVietnamWest Bank and GazaWorldYemen, Rep.ZambiaZimbabwe Timeline:
This timeline shows a graph from 1972 to 2003 of Malta. No data until 1971. Number of actual observations by date: 32.
Source name:
World Development Indicators
Source organization:
Development Assistance Committee of the Organisation for Economic Co-operation and Development, Geographical Distribution of Financial Flows to Developing Countries, Development Co-operation Report, and International Development Statistics database. Data are available online at: www.oecd.org/dac/stats/idsonline. World Bank imports of good and services estimates are used for the denominator.
Categories, topics:
Aid Effectiveness
Last updated:
apr 23, 2017
Indicators value changes by year
Minimum:
-0.284
jan 1, 1990
At the date of observation
Value
Absolute change
Change from previous value
jan 1, 1972
8.276
+8.276
0.0%
jan 1, 1973
7.12
-1.156
-13.97%
jan 1, 1974
9.891
+2.771
38.91%
jan 1, 1975
5.358
-4.533
-45.83%
jan 1, 1976
7.881
+2.523
47.08%
jan 1, 1977
6.337
-1.543
-19.58%
jan 1, 1978
5.272
-1.066
-16.82%
jan 1, 1979
5.821
+0.55
10.42%
jan 1, 1980
5.632
-0.189
-3.25%
jan 1, 1981
1.344
-4.288
-76.14%
jan 1, 1982
4.603
+3.258
242.43%
jan 1, 1983
2.549
-2.053
-44.62%
jan 1, 1984
4.95
+2.4
94.17%
jan 1, 1985
1.313
-3.636
-73.47%
jan 1, 1986
2.007
+0.694
52.83%
jan 1, 1987
0.615
-1.392
-69.37%
jan 1, 1988
-0.101
-0.716
-116.5%
jan 1, 1989
-0.168
-0.066
65.22%
jan 1, 1990
-0.284
-0.116
69.43%
jan 1, 1991
0.225
+0.509
-179.14%
jan 1, 1992
0.86
+0.635
282.43%
jan 1, 1993
0.164
-0.696
-80.96%
jan 1, 1994
1.14
+0.976
596.51%
jan 1, 1995
1.389
+0.249
21.86%
jan 1, 1996
0.248
-1.141
-82.15%
jan 1, 1997
1.994
+1.746
704.15%
jan 1, 1998
0.656
-1.338
-67.08%
jan 1, 1999
0.576
-0.08
-12.21%
jan 1, 2000
0.541
-0.036
-6.18%
jan 1, 2001
0.425
-0.116
-21.46%
jan 1, 2002
0.041
-0.384
-90.32%
jan 1, 2003
0.256
+0.215
522.67%
Ranking of countries by current statistics by years


Comments: