29
/
en
AIzaSyAYiBZKx7MnpbEhh9jyipgxe19OcubqV5w
April 1, 2024
63016
World
WLD
false
2
1
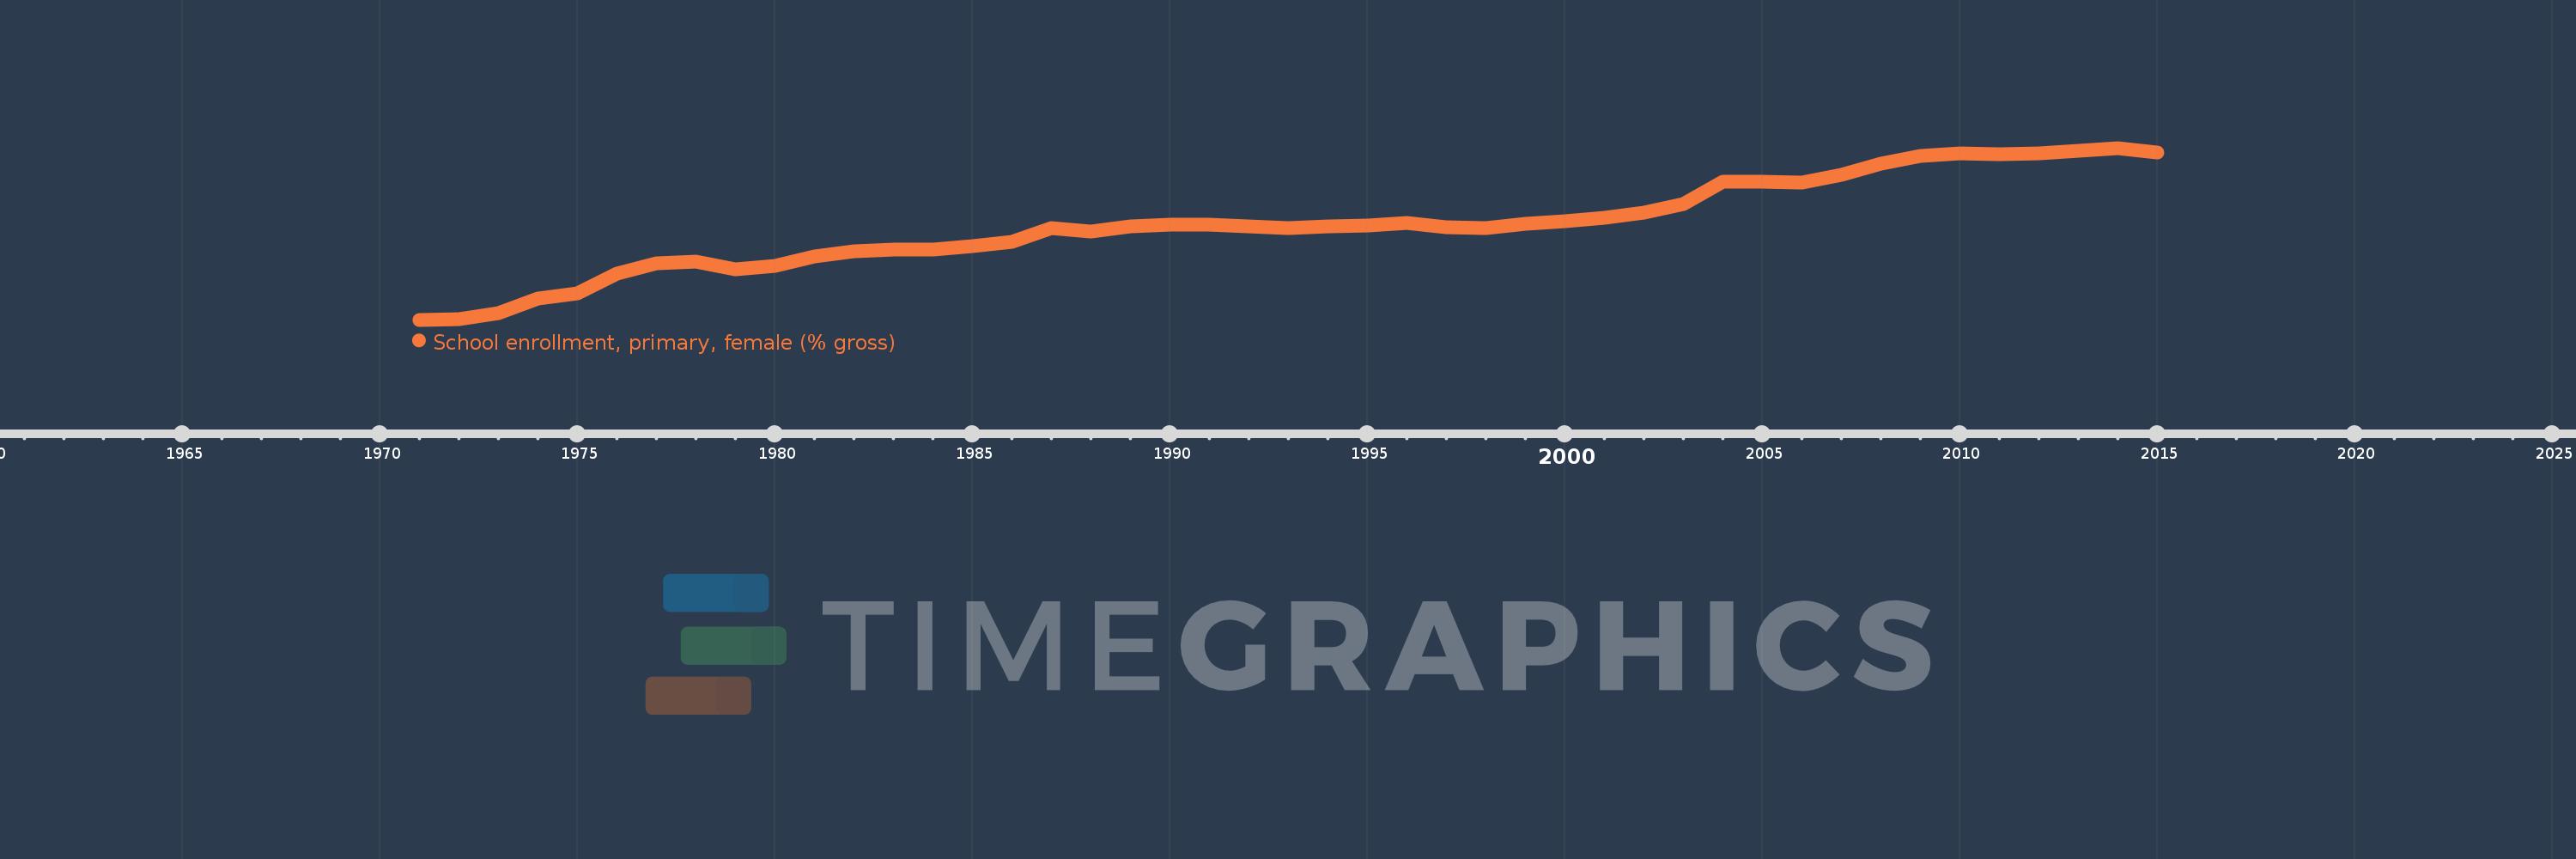
School enrollment, primary, female (% gross)
2015,2014,2013,2012,2011,2010,2009,2008,2007,2006,2005,2004,2003,2002,2001,2000,1999,1998,1997,1996,1995,1994,1993,1992,1991,1990,1989,1988,1987,1986,1985,1984,1983,1982,1981,1980,1979,1978,1977,1976,1975,1974,1973,1972,1971
This statistics in other country:
AfghanistanAlbaniaAlgeriaAndorraAngolaAntigua and BarbudaArab WorldArgentinaArmeniaArubaAustraliaAustriaAzerbaijanBahamas, TheBahrainBangladeshBarbadosBelarusBelgiumBelizeBeninBermudaBhutanBoliviaBosnia and HerzegovinaBotswanaBrazilBrunei DarussalamBulgariaBurkina FasoBurundiCabo VerdeCambodiaCameroonCanadaCaribbean small statesCentral African RepublicCentral Europe and the BalticsChadChileChinaColombiaComorosCongo, Dem. Rep.Congo, Rep.Costa RicaCote d'IvoireCroatiaCubaCuracaoCyprusCzech RepublicDenmarkDjiboutiDominicaDominican RepublicEarly-demographic dividendEast Asia & PacificEast Asia & Pacific (excluding high income)East Asia & Pacific (IDA & IBRD countries)EcuadorEgypt, Arab Rep.El SalvadorEquatorial GuineaEritreaEstoniaEthiopiaEuro areaEurope & Central AsiaEurope & Central Asia (excluding high income)Europe & Central Asia (IDA & IBRD countries)European UnionFijiFinlandFragile and conflict affected situationsFranceGabonGambia, TheGeorgiaGermanyGhanaGreeceGrenadaGuatemalaGuineaGuinea-BissauGuyanaHaitiHeavily indebted poor countries (HIPC)High incomeHondurasHong Kong SAR, ChinaHungaryIBRD onlyIcelandIDA & IBRD totalIDA blendIDA onlyIDA totalIndiaIndonesiaIran, Islamic Rep.IraqIrelandIsraelItalyJamaicaJapanJordanKazakhstanKenyaKiribatiKorea, Dem. People’s Rep.Korea, Rep.KuwaitKyrgyz RepublicLao PDRLate-demographic dividendLatin America & Caribbean Latin America & Caribbean (excluding high income)Latin America & the Caribbean (IDA & IBRD countries)LatviaLeast developed countries: UN classificationLebanonLesothoLiberiaLibyaLiechtensteinLithuaniaLow & middle incomeLow incomeLower middle incomeLuxembourgMacao SAR, ChinaMacedonia, FYRMadagascarMalawiMaldivesMaliMaltaMarshall IslandsMauritaniaMauritiusMexicoMicronesia, Fed. Sts.Middle East & North AfricaMiddle East & North Africa (excluding high income)Middle East & North Africa (IDA & IBRD countries)Middle incomeMoldovaMongoliaMontenegroMoroccoMozambiqueMyanmarNamibiaNauruNepalNetherlandsNew ZealandNicaraguaNigerNigeriaNorth AmericaNorwayOECD membersOmanOther small statesPacific island small statesPakistanPalauPanamaPapua New GuineaParaguayPeruPhilippinesPolandPortugalPost-demographic dividendPre-demographic dividendPuerto RicoQatarRomaniaRussian FederationRwandaSamoaSan MarinoSao Tome and PrincipeSaudi ArabiaSenegalSerbiaSeychellesSierra LeoneSlovak RepublicSloveniaSmall statesSolomon IslandsSomaliaSouth AfricaSouth AsiaSouth Asia (IDA & IBRD)South SudanSpainSri LankaSt. Kitts and NevisSt. LuciaSt. Vincent and the GrenadinesSub-Saharan Africa Sub-Saharan Africa (excluding high income)Sub-Saharan Africa (IDA & IBRD countries)SudanSurinameSwazilandSwedenSwitzerlandSyrian Arab RepublicTajikistanTanzaniaThailandTimor-LesteTogoTongaTrinidad and TobagoTunisiaTurkeyTurkmenistanTuvaluUgandaUkraineUnited Arab EmiratesUnited KingdomUnited StatesUpper middle incomeUruguayUzbekistanVanuatuVenezuela, RBVietnamWest Bank and GazaWorldYemen, Rep.ZambiaZimbabwe Timeline:
This timeline shows a graph from 1971 to 2015 of World. No data until 1970. Number of actual observations by date: 45.
Source name:
World Development Indicators
Source organization:
United Nations Educational, Scientific, and Cultural Organization (UNESCO) Institute for Statistics.
Categories, topics:
Education, Gender
Last updated:
apr 23, 2017
Indicators value changes by year
Minimum:
79.234
jan 1, 1971
Maximum:
104.786
jan 1, 2014
At the date of observation
Value
Absolute change
Change from previous value
jan 1, 1971
79.234
+79.234
0.0%
jan 1, 1972
79.266
+0.032
0.04%
jan 1, 1973
80.159
+0.893
1.13%
jan 1, 1974
82.453
+2.294
2.86%
jan 1, 1975
83.144
+0.69
0.84%
jan 1, 1976
86.079
+2.935
3.53%
jan 1, 1977
87.658
+1.579
1.83%
jan 1, 1978
87.934
+0.276
0.32%
jan 1, 1979
86.76
-1.174
-1.33%
jan 1, 1980
87.302
+0.542
0.62%
jan 1, 1981
88.684
+1.382
1.58%
jan 1, 1982
89.431
+0.747
0.84%
jan 1, 1983
89.725
+0.294
0.33%
jan 1, 1984
89.618
-0.107
-0.12%
jan 1, 1985
90.193
+0.575
0.64%
jan 1, 1986
90.8
+0.606
0.67%
jan 1, 1987
92.912
+2.112
2.33%
jan 1, 1988
92.383
-0.529
-0.57%
jan 1, 1989
93.098
+0.715
0.77%
jan 1, 1990
93.376
+0.278
0.3%
jan 1, 1991
93.342
-0.034
-0.04%
jan 1, 1992
93.175
-0.167
-0.18%
jan 1, 1993
92.912
-0.263
-0.28%
jan 1, 1994
93.138
+0.226
0.24%
jan 1, 1995
93.309
+0.171
0.18%
jan 1, 1996
93.587
+0.279
0.3%
jan 1, 1997
93.003
-0.584
-0.62%
jan 1, 1998
92.918
-0.086
-0.09%
jan 1, 1999
93.523
+0.605
0.65%
jan 1, 2000
93.857
+0.335
0.36%
jan 1, 2001
94.426
+0.569
0.61%
jan 1, 2002
95.157
+0.73
0.77%
jan 1, 2003
96.404
+1.247
1.31%
jan 1, 2004
99.824
+3.42
3.55%
jan 1, 2005
99.792
-0.031
-0.03%
jan 1, 2006
99.677
-0.115
-0.12%
jan 1, 2007
100.823
+1.146
1.15%
jan 1, 2008
102.433
+1.61
1.6%
jan 1, 2009
103.655
+1.222
1.19%
jan 1, 2010
104.008
+0.353
0.34%
jan 1, 2011
103.836
-0.171
-0.16%
jan 1, 2012
103.933
+0.097
0.09%
jan 1, 2013
104.363
+0.43
0.41%
jan 1, 2014
104.786
+0.423
0.41%
jan 1, 2015
104.13
-0.656
-0.63%
Ranking of countries by current statistics by years


Comments: